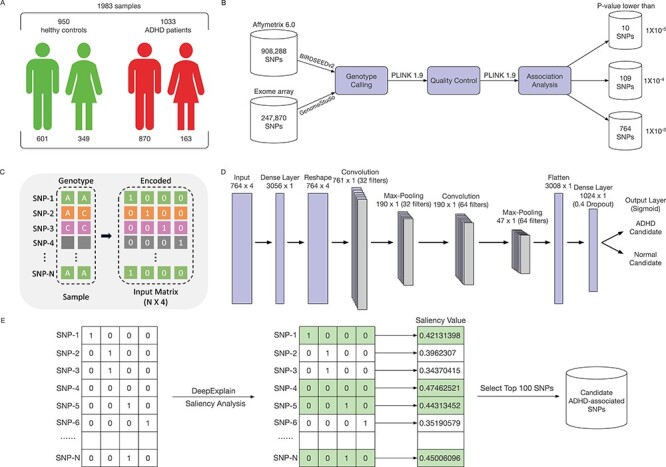
Figure 1 .

The overview of our ADHD classification pipeline. (A) The sample information of the our project. A total of 1033 ADHD patients (870 males, 84.2%) and 950 healthy controls (601 males, 63.3%) were included in this study. (B) The feature selection process for our deep leanring model. (C) The encoding schema for the genotype data. An input genotype data of one sample are first encoded to a  input matrix where N is the total SNP number. The gray cells means the genotype missing for SNPs. (D) The CNN architecture of our deep learning model. (E) The saliency analysis to find the candidate ADHD-associated SNPs.
