
Figure 3 .
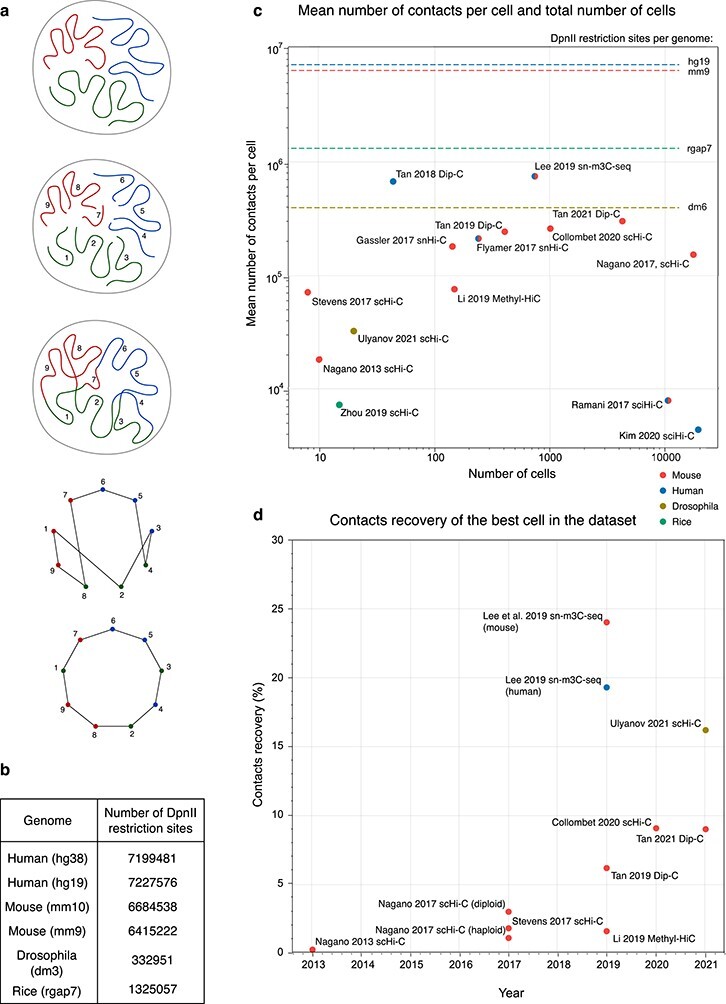
A. Illustrative upper bound estimation of the possible number of pairwise contacts per single cell. The theoretical genome has nine restriction fragments that form a circle graph after ideal ligation (nodes are restriction fragments with the valency of 2, edges denote ligation of their ends). B. Total numbers of DpnII restriction sites for the single copies of popular genomes. C. Descriptive statistics of published scHi-C studies. The lines represent the upper bounds for the possible number of contacts per single cell from (B). Colour indicate species. D. The best cells for some of the published scHi-C datasets as a function of the publication time. For C and D, we use the numbers reported in the supplementary materials of the original studies, when possible. For each study, we indicate the first author and the names of scHi-C techniques self-reported by the authors. For [49] and [76], the mean is calculated based on the median count per dataset. For [86], we used the cleaned contacts after removal of damaged cells. For [55], the calculated mean is based on the numbers reported for 741 cells in the supplementary table.