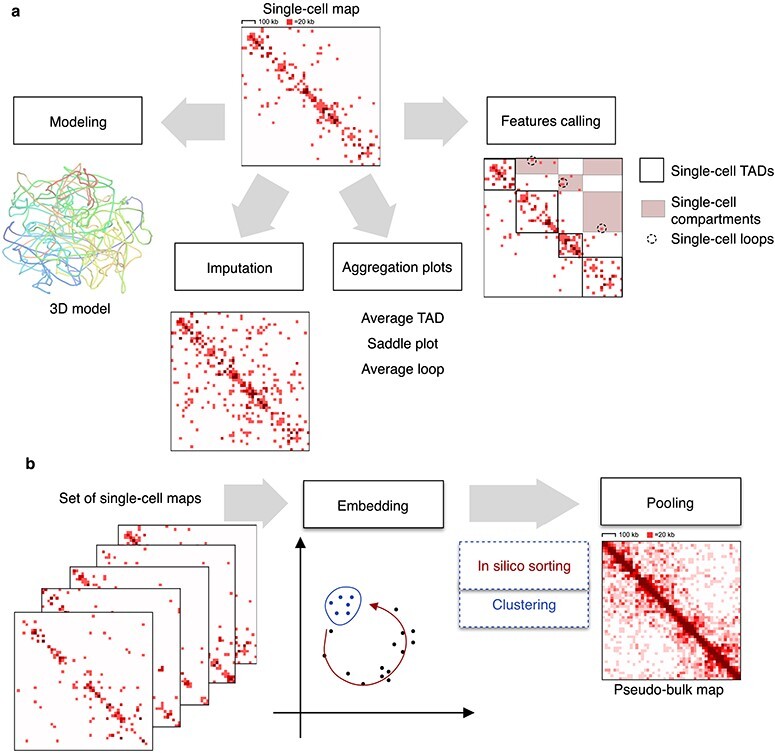
Figure 4 .

Approaches to studying a single scHi-C map (A) and a set of scHi-C maps (B). Single-cell Hi-C maps from [28] for the region chr1:9000000-1000000.

Approaches to studying a single scHi-C map (A) and a set of scHi-C maps (B). Single-cell Hi-C maps from [28] for the region chr1:9000000-1000000.