Figure 4.

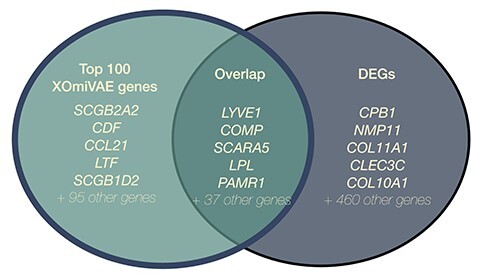
A Venn diagram representing the overlap between the DEGs and top contribution genes, highlighting a total of 42 DEGs found in the top 100 contribution genes.

A Venn diagram representing the overlap between the DEGs and top contribution genes, highlighting a total of 42 DEGs found in the top 100 contribution genes.