Figure 2.
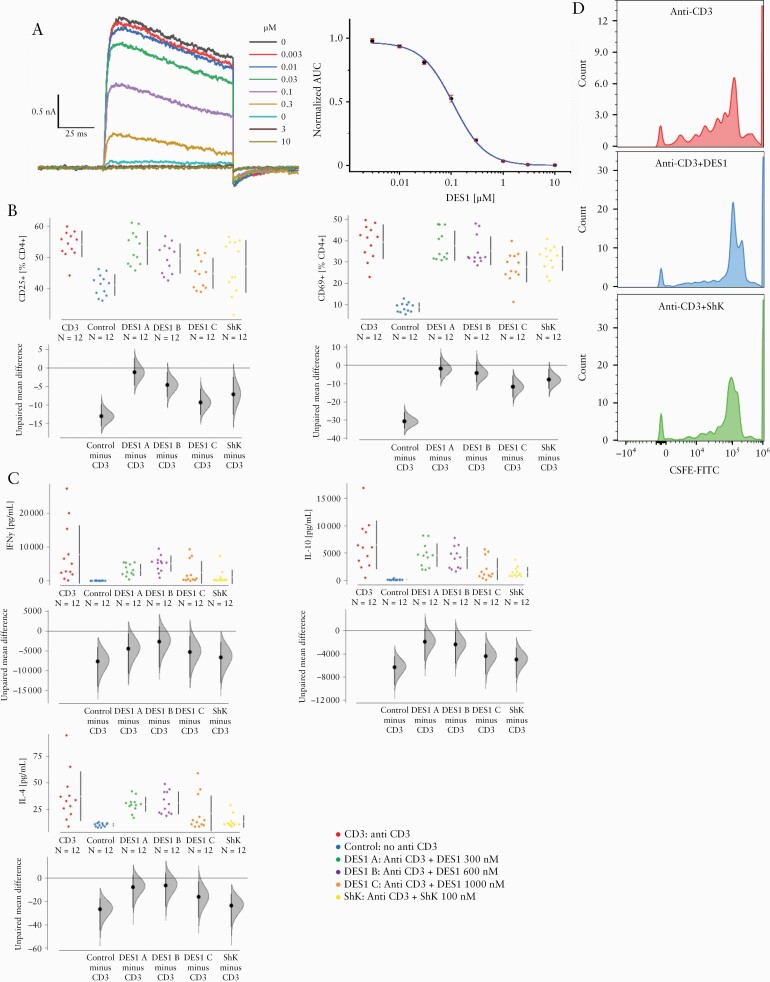
DES1 inhibits Kv1.3 activation in vitro. [A] Analysis of inhibition of Kv1.3 by automated patch clamp analysis in mammalian CHO cells recombinantly expressing the human channel. Whole-cell current recordings at increasing concentrations [left] and a single, representative dose-response curve for the human channel [right]; each data point is an average of triplicate recordings, and the area under curve [AUC] measured at the 20th pulse was used to determine the IC50. [B, C] DES1 inhibits T-cell activation and cytokine production in a concentration-dependent manner. PBMCs [1 E-06 cells] were incubated in 1.5 mL RPMI for 48 h in the absence [Control] or presence [CD3] of anti-CD3 antibodies [0.31 ng/mL] and increasing concentrations of DES1 [DES1 A: 300 nM, DES1 B:600 nM, DES1 C: 1000 nM]. ShK [100 nM] served as a control. [biological n = 2, technical n = 3] [B] Flow cytometric analysis of frequencies of activated CD4+ T cells [CD25+ and CD69+] depicted as Cumming plots. [C] Analysis of cytokine secretion by Luminex assay. The upper part of the plot presents each data point in a swarm plot. In the lower panel of the plots, the effect sizes are shown. The 0 point of the difference axis indicates the mean of the reference group [CD3]. The dots show the difference between groups [effect size]. The shaded curve shows the entire distribution of excepted sampling error for the difference between the means. The error bar in the filled circles indicates the 95% confidence interval [bootstrapped] for the difference between means. [D] CellTrace carboxyfluoresceinsuccinimidylester [CFSE] dilution of CD4+ T cells. PBMC, peripheral blood mononuclear cells.

