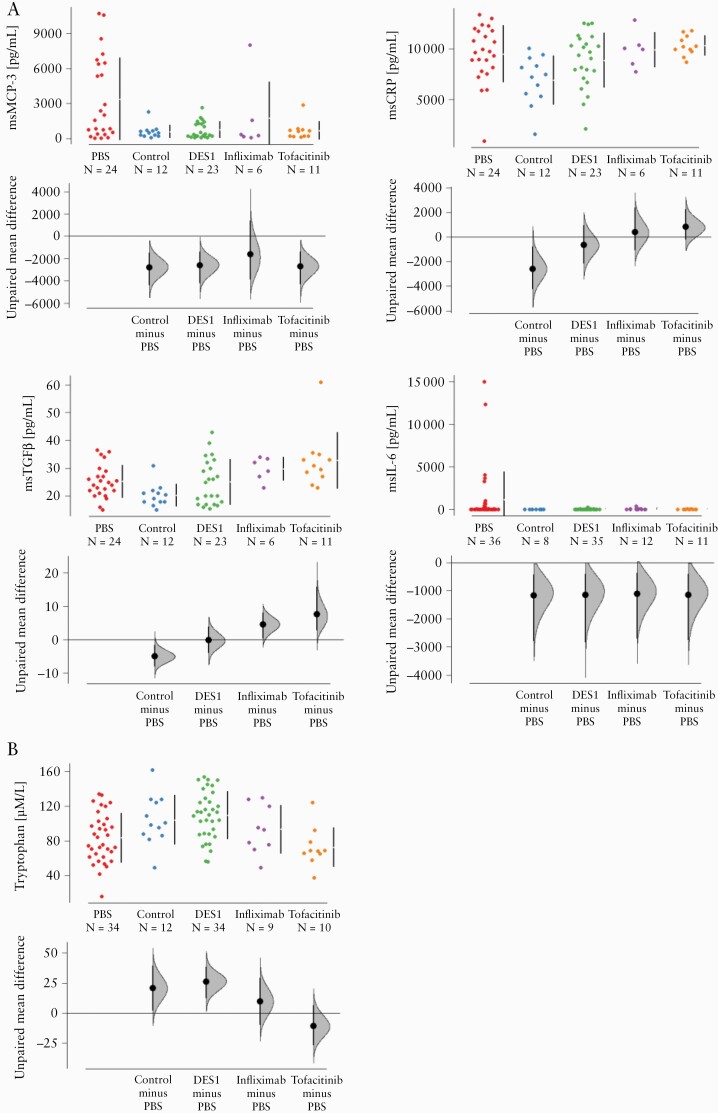
Figure 4.
Treatment of NSG-UC mice with DES1, infliximab, and tofacitinib affect inflammatory markers. NSG-UC mice were treated as described in Figure 3. [A] msCRP-3, msTGFß, msCRP, msIL-6 levels in colon extracts of mice depicted as Cumming plots. [B] Serum tryptophan levels depicted as Cumming plots. The upper part of the plot presents each data point in a swarm plot. In the lower panel of the plots, the effect sizes are shown. The zero [0] point of the difference axis indicates the mean of the reference group [PBS]. The dots show the difference between groups [effect size]. The shaded curve shows the entire distribution of excepted sampling error for the difference between the means. The error bar indicates the 95% confidence interval [bootstrapped] for the difference between means [filled circles].

