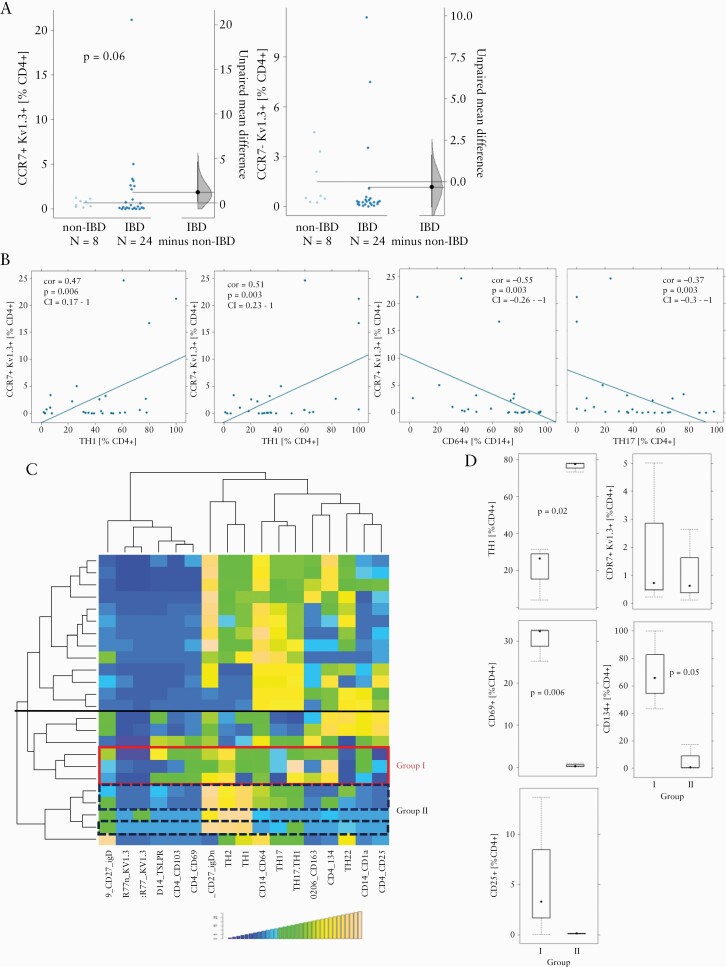
Figure 6.
Responsiveness to DES1 correlated with activated CD4+ T cells. [A] Frequencies of Kv1.3-expressing effector and memory/naive T cells in PBMCs from IBD [n = 27 patients and non-IBD [n = 8] donors depicted as Cumming plots.26 The left part of the plot presents each data point in a swarm plot. In the right part panel of the plots, the effect sizes are shown. The 0 point of the difference axis indicates the mean of the reference group [non-IBD]. The dots show the difference between groups [effect size]. The shaded curve shows the entire distribution of excepted sampling error for the difference between the means. The error bar in the filled circles indicates the 95% confidence interval [bootstrapped] for the difference between means. [B] Correlation analysis of frequencies of Kv1.3-expressing T cells with TH1, TH2, TH17, and M1 monocytes displayed as scatter plots [TH1 and TH2 frequencies originate from distinct gating procedures and their sum thus exceeds 100%]. Method = Pearson, numbers display Pearson’s product-moment correlation values [cor], p-values [p], and 95% confidence interval [CI]. [C] Hierarchically clustered heatmap of 24 patients. The horizontal black line separates the two main subgroups of inflammation. The coloured boxes indicate profiles of donors selected for reconstitution [red: group I; blue, dashed line: group II]. [D] Frequencies of subtypes of immune cells in group I and group II depicted as boxplots. Boxes represent upper and lower quartiles, whiskers represent variability, and outliers are plotted as individual points. PBMC, peripheral blood mononuclear cells; IBD, inflammatory bowel disease.

