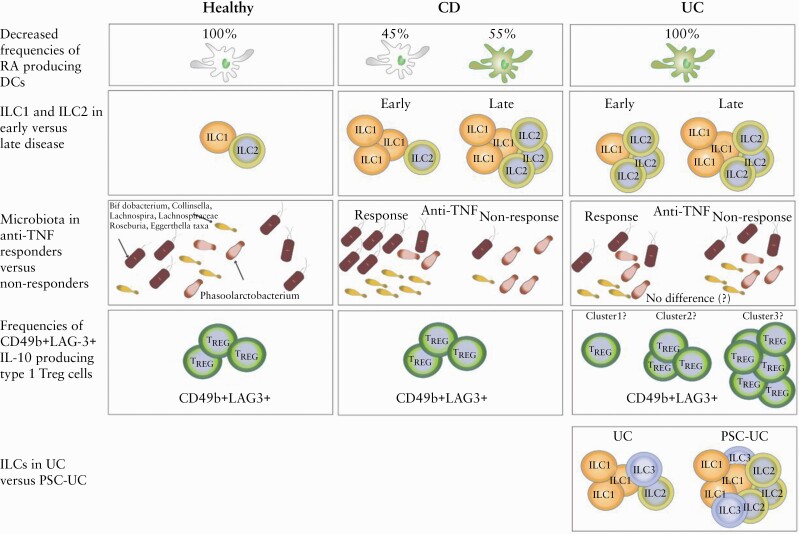
Figure 2.
Examples of heterogeneity between UC, CD and healthy subjects. The first row illustrates how in UC all the DCs have decreased capacity to produce RA [green DCs] compared with healthy individuals [white DCs], whereas DCs from CD patients show heterogeneity in their RA production capacity.84 The second row illustrates that in early CD the abundance of colonic ILC1s is selectively increased, whereas in early UC the abundance of ILC2s is increased.98 Later in the disease course, ILC1s and ILC2s are increased compared with healthy individuals in both disease groups.98 The third row shows an example of microbiota-based clustering, where CD patients responding to anti-TNF treatment have increased abundance of Bifidobacterium, Collinsella, Lachnospira, Lachnospiraceae, Roseburia, and Eggerthella taxa and reduction in Phascolarctobacterium compared with anti-TNFα non-responders, whereas UC patients do not seem to show clustering based on these bacteria and anti-TNF response.61 The fourth row exemplifies a possible clustering strategy based on CD49b+LAG-3+ IL-10-producing type 1 TREG cells that show more variable frequencies in UC compared with CD.85 The fifth row illustrates that UC patients with PSC have higher abundance of colonic ILCs compared with UC patients without PSC.96 CD, Crohn’s disease; UC, ulcerative colitis; IL, interleukin; Th, T helper cell; ILC, innate lymphoid cell; DC, dendritic cell; RA, retinoic acid; TNF, tumour necrosis factor; PSC, primary sclerosing cholangitis.

