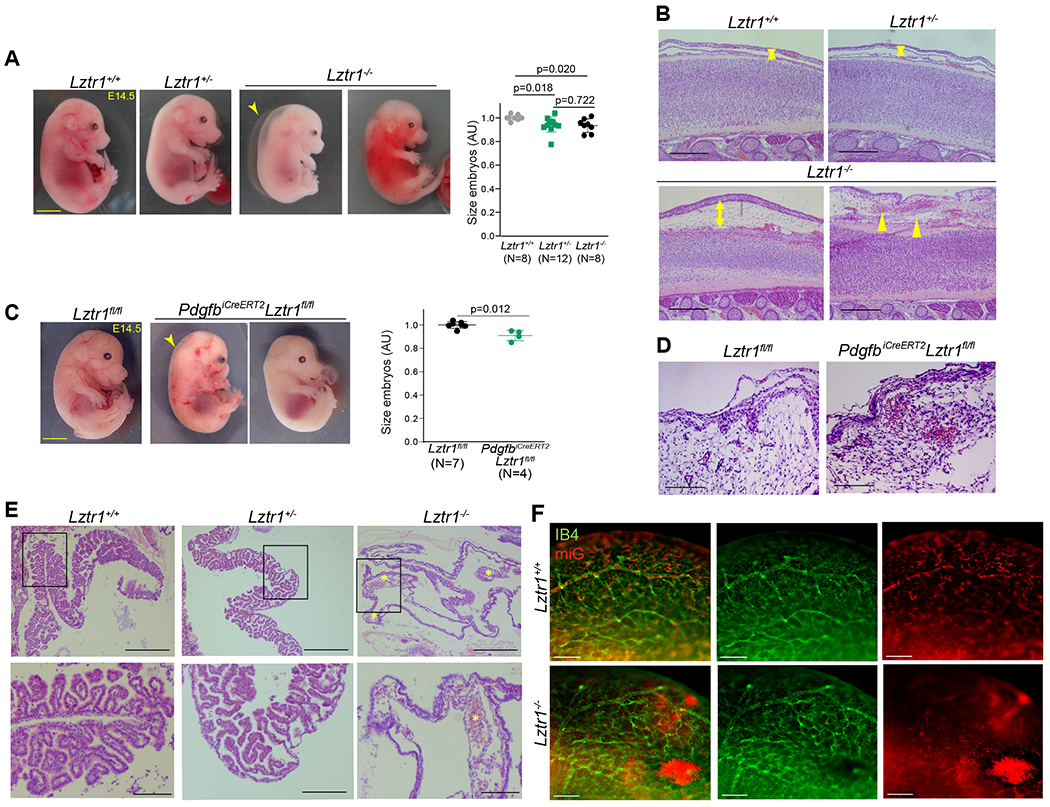
Figure 1. Loss of Lztr1 leads to vascular defects during embryogenesis.

(a) Representative images of Lztr1+/+, Lztr1+/−, and Lztr1−/− embryos at E14.5. The arrowhead indicates hydrops. Scale bar 1 mm. Size of E14.5 embryos is shown as mean ± SEM; p-values were assessed by Kruskal-Wallis test with Dunn’s Multiple Comparison Test. (b) H&E-stained sections of the back skin of E14.5 Lztr1+/+, Lztr1+/−, and Lztr1−/− embryos. Arrowheads indicate hemorrhages; arrows denote dermis thickness. Scale bar 200 μm. (c) Representative images of Lztr1fl/fl and PdgfbiCreERT2, Lztr1fl/fl embryos at E14.5. The arrowhead indicates nuchal translucency. Scale bar 1 mm. Size of E14.5 embryos is shown as mean ± SEM; p-values were assessed by Wilcoxon-Mann-Whitney test. (d) H&E-stained sections of the head of Lztr1fl/fl and PdgfbiCreERT2, Lztr1fl/fl embryos at E14.5. Scale bar 100 μm (e) H&E-stained sections of Lztr1+/+, Lztr1+/− and Lztr1−/− yolk sacs. * indicates enlarged vascular structure. Scale bar 200 and 500 μm, respectively. (f) 3D vasculature of brain (cephalic plexus) imaged after whole mount-staining of E14.5 embryos with Isolectin B4 (IB4), mouse iG (miG), and clearing. Scale bar 200 μm.
