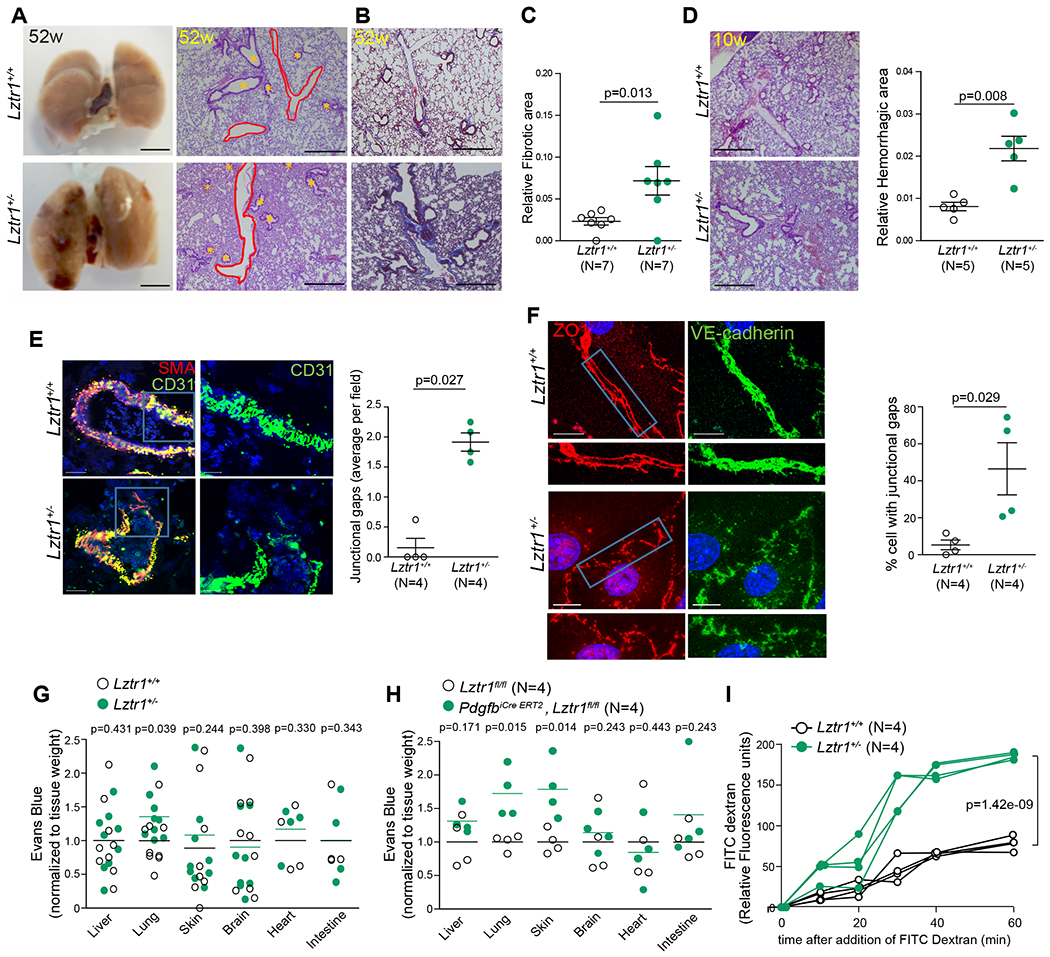
Figure 2. Loss of Lztr1 leads to pulmonary vascular disease.

(a) Gross anatomy and H&E-staining of lungs of 52-week old Lztr1+/+ and Lztr1+/− mice. Scale bar 500 μm. * indicate bronchioles; pulmonary vessels are delineated in red. (b) Masson Trichrome–stained sections of Lztr1+/+ and Lztr1+/− lungs. Fibrosis is colored in blue. Scale bar 500 μm. (c) Fibrotic area in lungs of 52-week old Lztr1+/+ and Lztr1+/− mice. Data are shown as mean ± SEM; p-values were assessed by Wilcoxon-Mann-Whitney test. (d) H&E-staining of lungs of 10-week old Lztr1+/+ and Lztr1+/− mice. Scale bar 500 μm. Hemorrhagic area is shown as mean ± SEM; p-values were assessed by Wilcoxon-Mann-Whitney test. (e) Lungs of 52-week old Lztr1+/+ and Lztr1+/− mice immunostained with anti-SMA and anti-CD31 antibodies. Data are shown as mean±SEM; p-values were assessed by Wilcoxon-Mann-Whitney test. Scale bar 20 μm. (f) ECs isolated from Lztr1+/+ and Lztr1+/− mice immunostained with antibodies against VE-cadherin and ZO1. Blue rectangles delineate the magnified areas (below). Data are shown as mean ± SEM; p-values were assessed by Wilcoxon-Mann-Whitney test. Scale bar 20 μm. (g) Evans blue extravasation from lungs of Lztr1+/+ and Lztr1+/− mice. Lines shows mean; p-values were assessed by Wilcoxon-Mann-Whitney test. (h) Evans blue extravasation from Lztr1fl/fl and PdgfbiCre ERT2, Lztr1fl/fl tissues. Lines shows mean; p-values were assessed by Wilcoxon-Mann-Whitney test. (i) Paracellular permeability of Lztr1+/+ and Lztr1+/− ECs as measured by quantifying FITC Dextran fluorescence in a trans-well assay. P-values were assessed by two-way ANOVA with Bonferroni post-tests.
