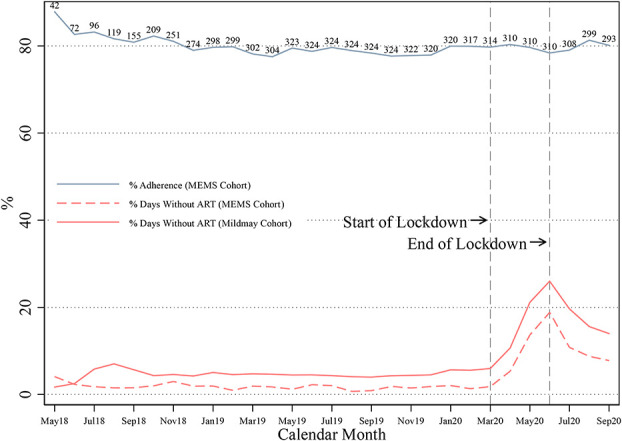
FIGURE 1.

ART adherence and days without personal ART supply over time. Numbers above the adherence line represent sample sizes for each month for the MEMS cohort. % of days without ART reflects the share of client days in a given month where ART supply was 0. This measure is based on pharmacy refill records and assumes clients took their pills as prescribed. The full Mildmay cohort includes all clients with at least 2 ART prescriptions between July 2019 and March 2020. The MEMS cohort is the subset for which we have MEMS cap data. Although the “lockdown” in Kampala was eased in June 2020, several restrictions were still in place by September 2020.
