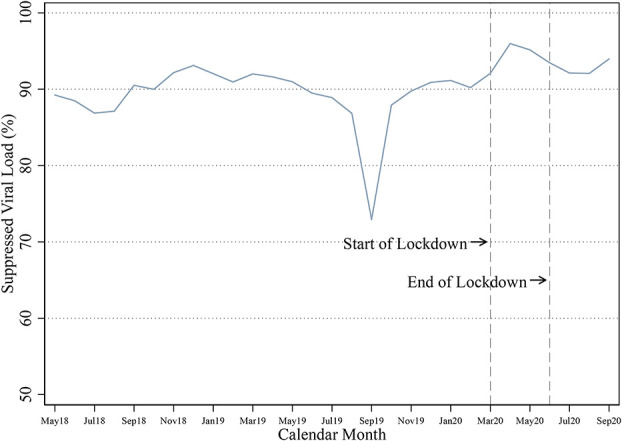
FIGURE 2.

Share of clients with suppressed viral load by month. Data are from all viral load tests conducted for the full Mildmay cohort from May 2018 to September 2020 (36,356 tests for 14,632 unique clients). The full Mildmay cohort includes all clients with an ART prescription between July 2019 and March 2020. This figure plots the share of viral load tests in each month that recorded a suppressed viral load (<200 copies/mL). We are not sure why there is a dip in September 2019, but this could be because one of the viral load machines was down and the remaining machine could have had higher sensitivity. Although the “lockdown” in Kampala was eased in June 2020, several restrictions were still in place by September 2020.
