
Figure 2: Renal fibrosis in HFpEF mice.
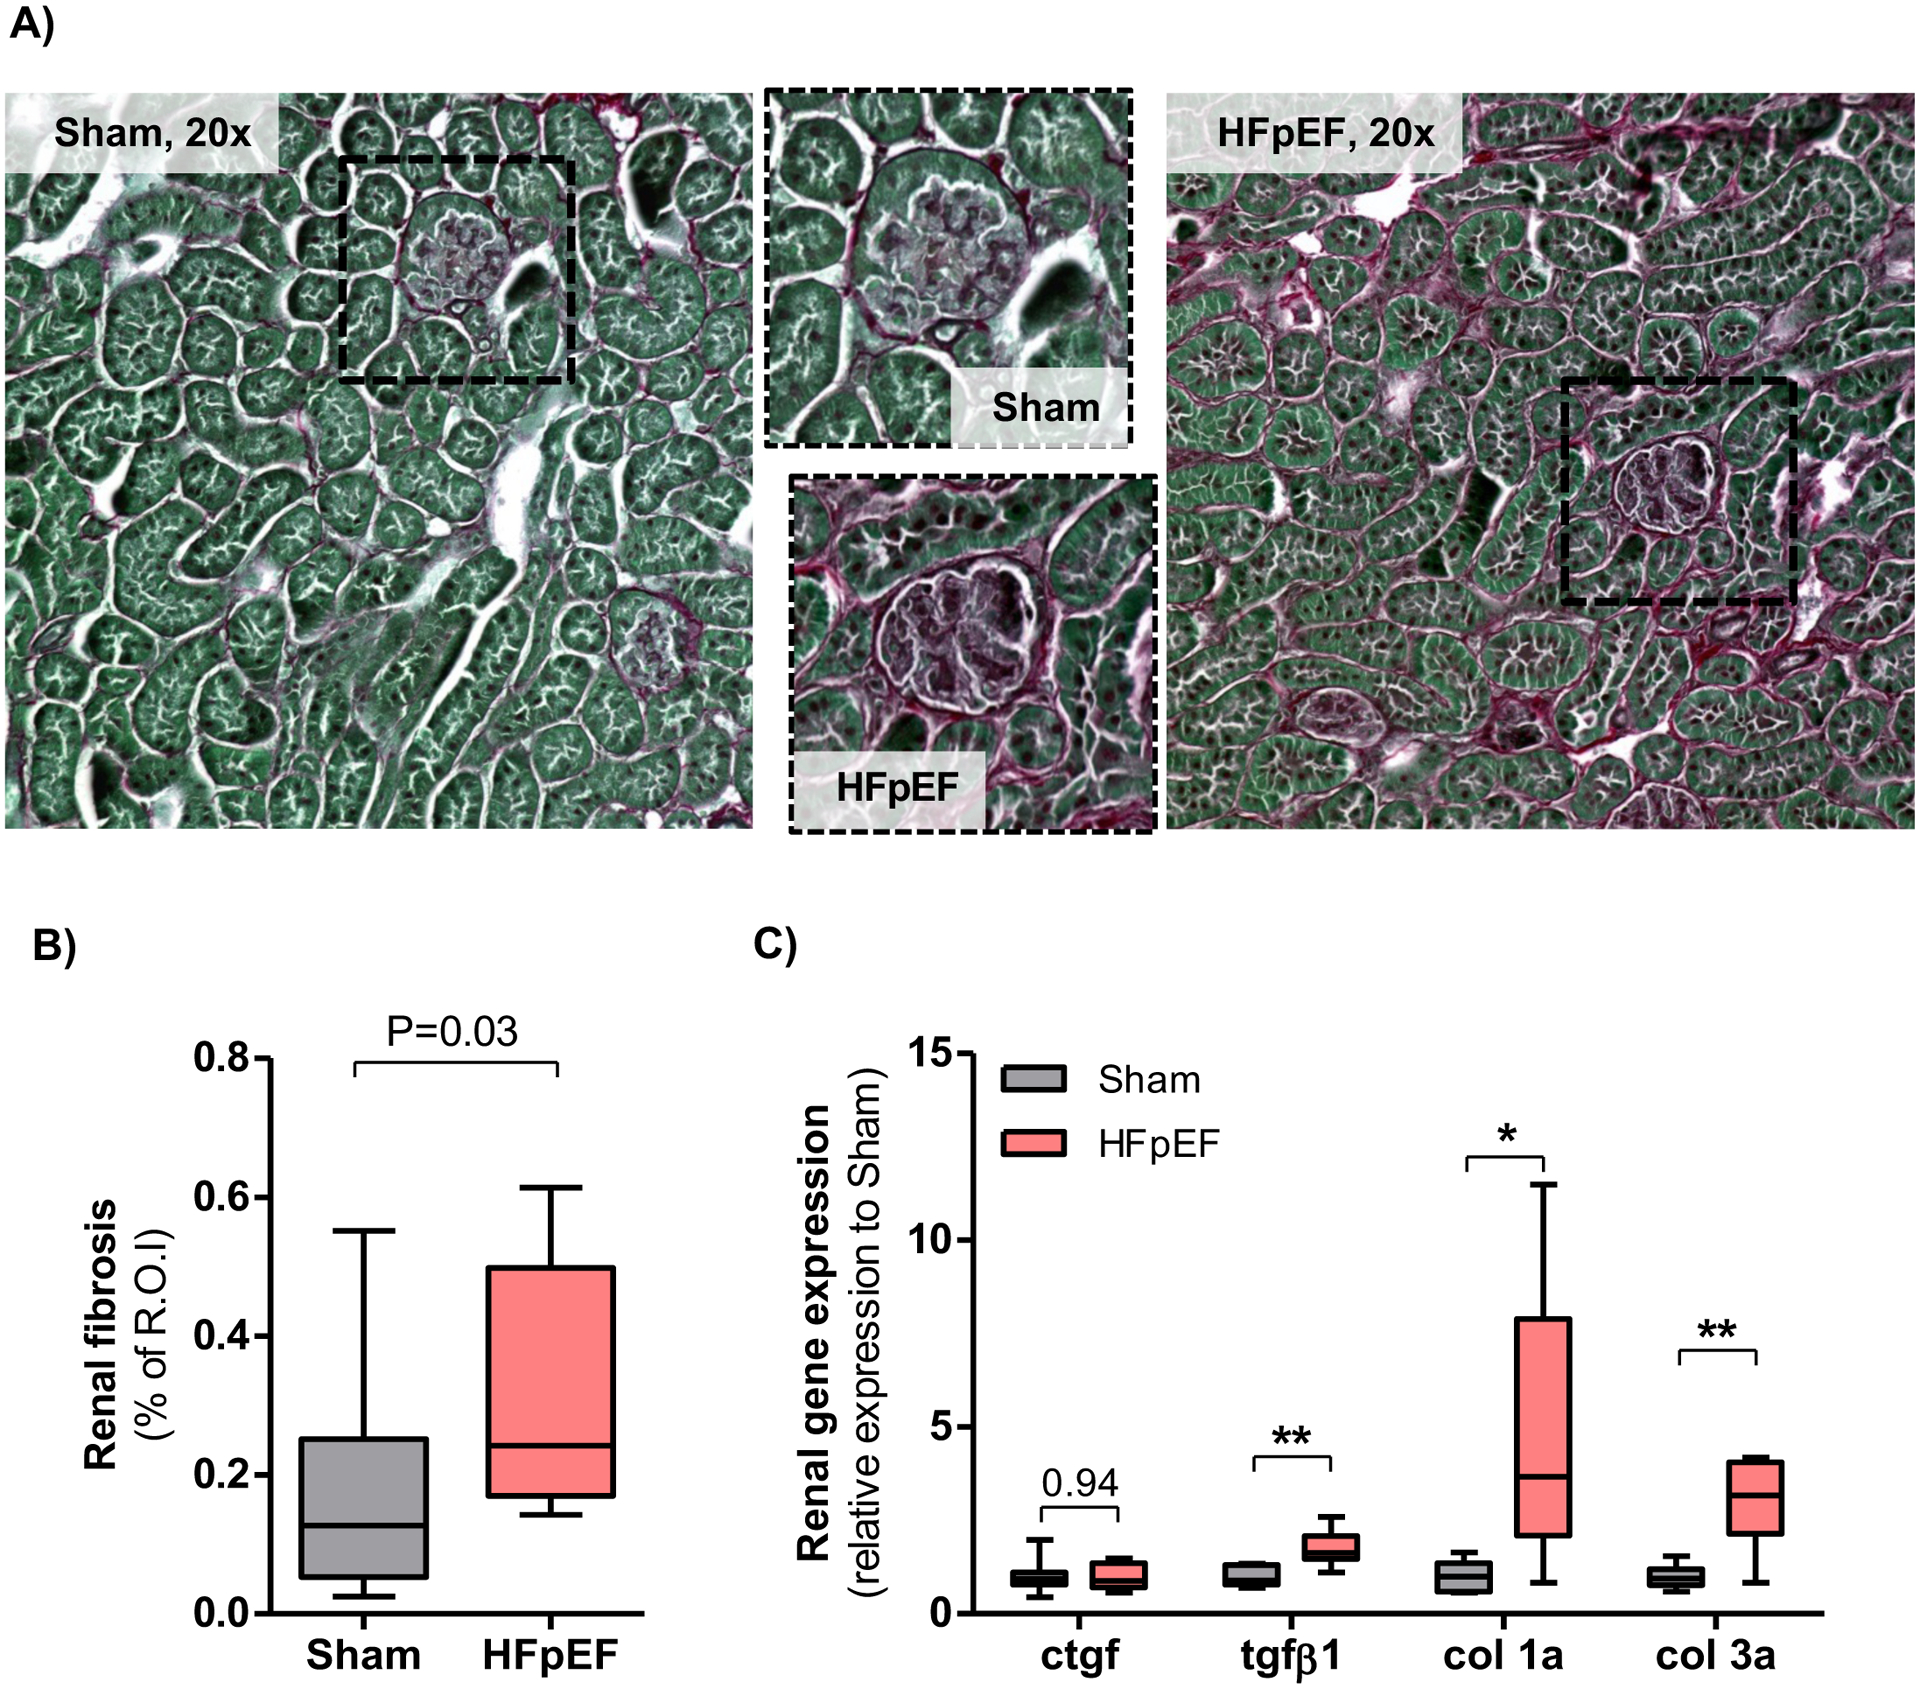
(A) Representative staining of collagen deposition (Picrosirius red, ×20) in kidneys from Sham and HFpEF mice. (B) Quantification of renal fibrosis with Pricosirius red staining in Sham and HFpEF mice. n = 10/group; R.O.I is region of interest. (C) Analysis of gene expression of fibrotic markers (connective tissue growth factor [ctgf], transforming growth factor beta1 [tgf-β1], collagen 1a [col 1a] and collagen 1a [col 3a]) in the kidneys of Sham and HFpEF mice. n = 8–10/group. Statistical analysis by 2-tailed Student t test for normally distributed data or Mann-Whitney U for those variables that were non-normally distributed. *P<0.01; **P<0.001.