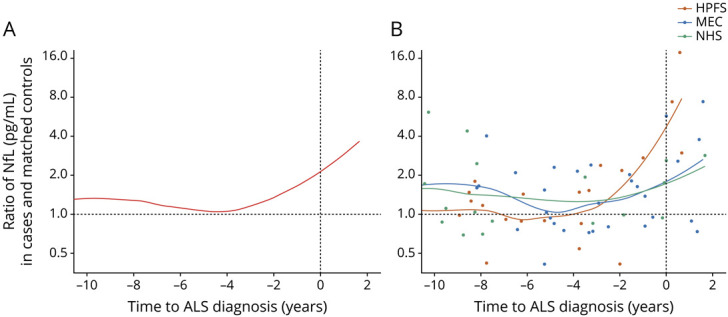
Figure 2. Ratio of Neurofilament Light Chain (NfL) Levels in Amyotrophic Lateral Sclerosis (ALS) Cases and Matched Controls According to Time to ALS Diagnosis.

The figure illustrates the relative difference (ratio) in NfL levels in ALS cases and matched controls. The locally estimated scatterplot smoothing (LOESS) curve illustrates the changes in the ratio over time. Each point corresponds to 1 case–control pair/triplet. (A) The LOESS curve was estimated from all case–control pairs/triplets. (B) A LOESS curve was estimated for each cohort separately. HPFS = Health Professionals Follow-up Study; MEC = Multiethnic Cohort Study; NHS = Nurses' Health Study.
