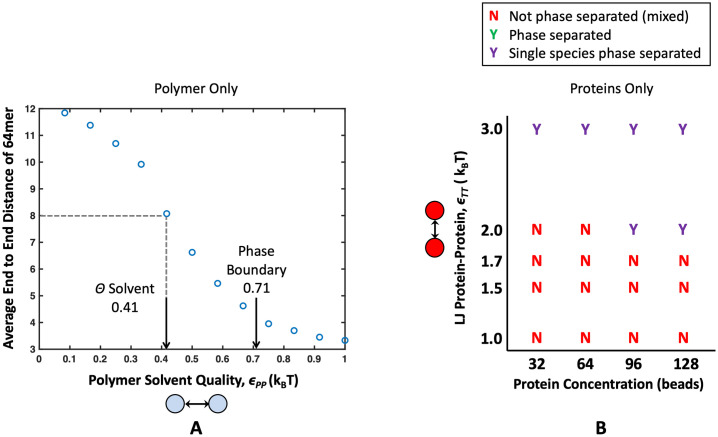
Fig 3. Properties of a single species alone, before mixing them together.
(A) Average end-to-end distance of a 64mer polymer under various Lennard-Jones attractions ϵPP. The polymer behaves as it would in θ conditions, as a perfect random walk, when ϵPP = 0.41. ϵPP = 0.71 is highlighted with an arrow to denote the attraction at which four 16mer polymers aggregate into a single condensate. From this, we can see there is a region of poor solvent where polymers are collapsed but still soluble. (B) Phase diagram showing solubilities of binding proteins alone. When targets form a condensed phase without polymer, it is denoted with a purple “Y”, and when they do not form a condensed phase, it is denoted with a red “N”. From this chart, we see that all target concentrations tested are phase separated when ϵTT = 3.0, no target concentrations nucleate a condensed phase at ϵTT = 1.7, and only high target concentrations 96 and 128 targets phase separate at ϵTT = 2.0. This phase diagram will serve as a control for the effects of mixing polymers and target proteins. This figure is adapted from Zumbro et al. with permission from Elsevier [18].

