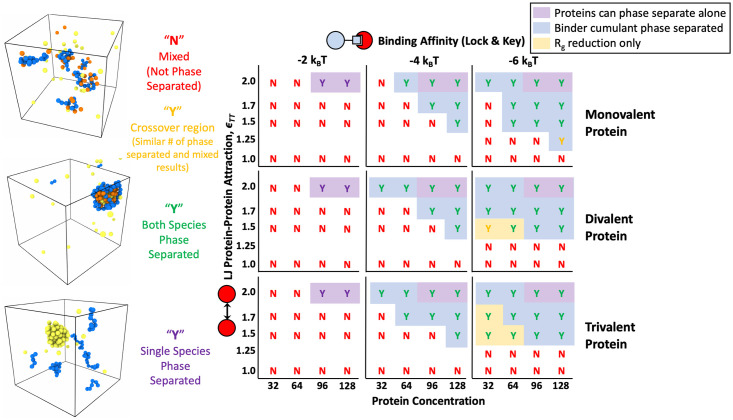
Fig 4. Phase diagram resulting from specific lock-and-key binding to four 16mer polymers.
Results are shown for mono, di, and trivalent binding proteins with ΔE0 = −2, −4, and −6kBT. Letters and letter coloring were determined by visual inspection, with example renderings shown on the left for “Mixed” states (top rendering) labeled as a red “N” for no phase separation, fully phase separated systems with both polymers and proteins found in the condensed phase are labeled with a green “Y” for yes phase separated (middle rendering), and purple “Y”s denote systems in which a single species phase separated without the other such as the proteins condensing on their own (bottom rendering). Yellow “Y”s denote systems in a the crossover region between the phase separated and mixed states where 60% of simulations showed a stable condensed droplet. The “crossover region” can be thought of as very close to the phase boundary where the system is crossing over from the mixed to phase separated state and fluctuations are the highest. Purple background shading denotes regions where pure protein simulations phase separated on their own without the help of the polymer. Blue background shading denotes the regions where phase separation was also indicated by Binder cumulant of the system energy. Yellow background shading denotes that aggregation of polymers into a droplet was indicated by a significant drop in the total Rg of the polymer system accompanied by a reduction in the Rg of individual polymers. In the renderings, polymer beads are shown in blue, bound protein beads are shown in orange, and unbound protein beads are shown in yellow. Phase separation occurs at lower protein target concentrations and lower ϵTT as valency and binding affinity are increased.

