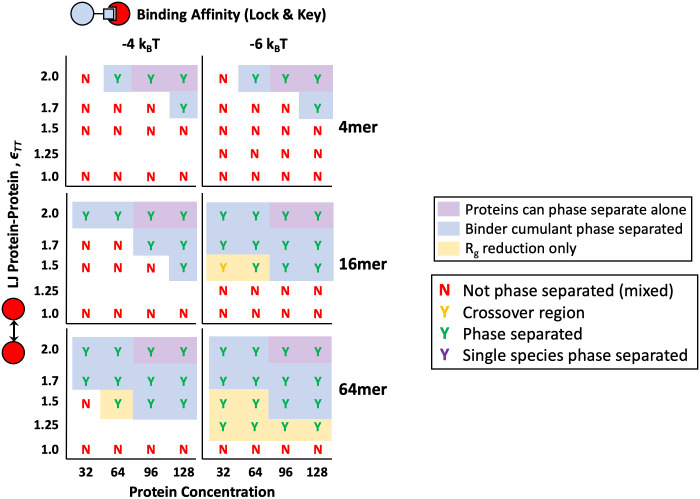
Fig 6. Phase diagrams for polymers of different of degrees of polymerization.
Np = 4 (Top Row), 16 (Middle Row), and 64 (Bottom Row) with reactive, specific binding affinities ΔE0 = −4 and −6kBT. All simulations are for divalent protein targets and theta solvent for the polymer. Letter color coding and area shading have the same meanings as described in Fig 4.

