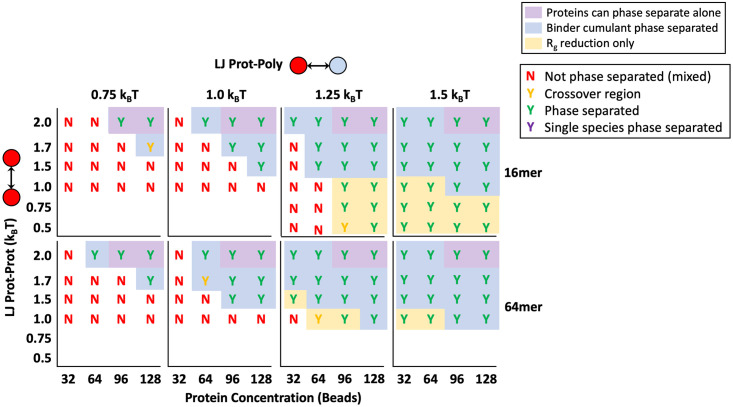
Fig 8. Non-specific binding phase diagram.
Phase diagram for proteins binding to polymers through a non-specific Lennard-Jones potential. Diagrams use the same key described in detail in Fig 4 where phase separated systems are marked with a “Y” for “yes” and not phase separated systems are marked with an “N” for “no.” Results are shown for simulations with increasing polymer binding attractions ϵTP from left to right (columns) with four 16mer polymers (Top) and one 64mer polymer (Bottom).

