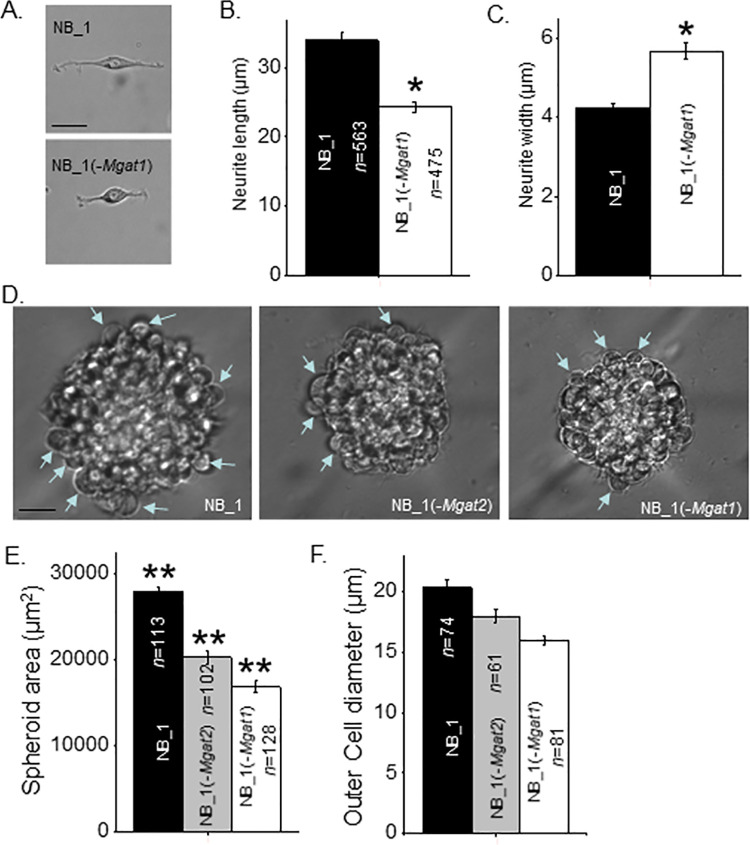
Fig 2. Morphology of NB cells and NB spheroids are dependent on the type of N-glycan.
(A) Representative images of NB_1 and NB_(-Mgat1) cells from 2D cell cultures. Length (B) and width (C) of neurites from cells grown in 2D cell cultures. (D) Typical images of 7 days old spheroids obtained at 40x magnification. Blue arrowhead depicts measured cells at outer edge of sphere. (E) Quantification of spheroid size determined from images obtained at 10x magnification. (F) Diameter of cells at outer edge of sphere were quantified. Scale bars are 25 μm. Data are presented as the mean±SEM and were compared by one-way ANOVA followed by Holm-Bonferroni adjustment (*p < 0.02, **p<0.001). n denotes the number of neurites, cell diameters or spheroids measured, respectively.

