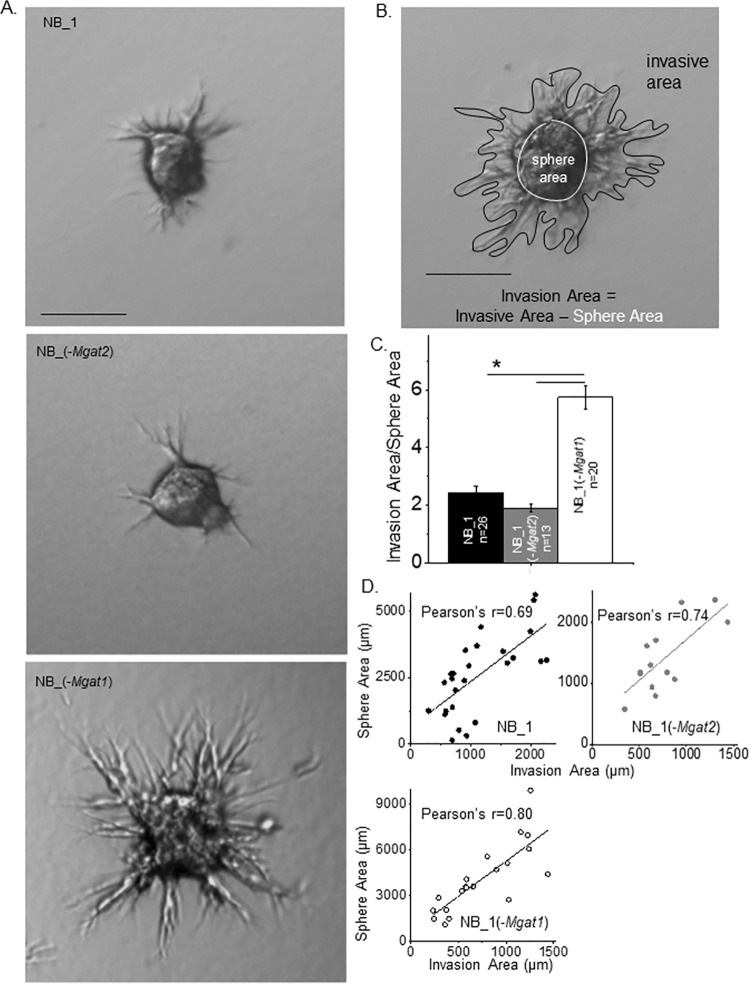
Fig 5. Disruption in the N-glycosylation pathway modifies 3D cell invasion.
(A) Images of representative cell invasiveness from 1-day old spheroids of parental and N-glycosylation mutant cell lines cultured for 24 h in Matrigel matrix. (B) Micrograph of invading spheroid cells indicating measured sphere and invasive areas. Scale bars represent 25 μm. (C) The ratio of the invasion area to the sphere area were determined and plotted for NB_1 (n = 22), NB_1(-Mgat2) (n = 15) and NB_1(-Mgat1) (n = 18) cell lines. (D) Pearson’s correlation coefficients from plots of sphere area versus invasion area for each cell line. Data are presented as the mean±SEM and were compared by one-way ANOVA using Holm-Bonferroni test (*p < 0.05). n denotes number of spheroids measured.

