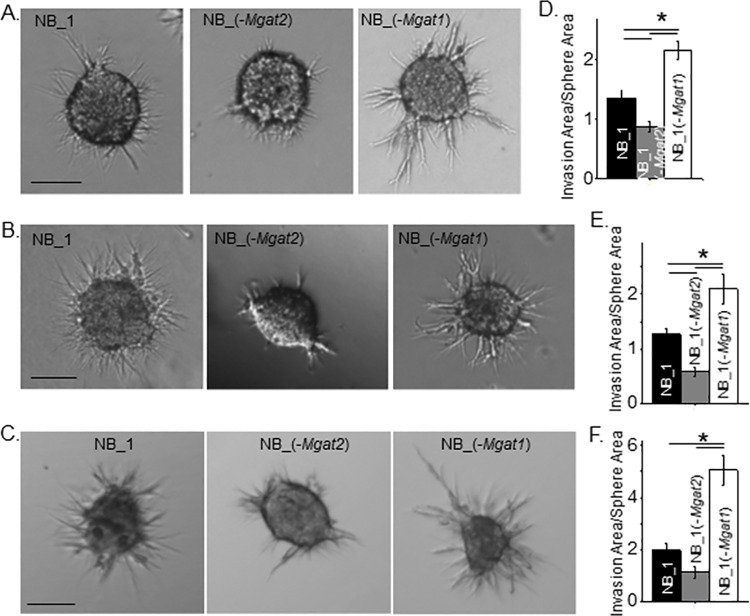
Fig 6. NB cell invasion is independent of spheroid cell size and dependent on incubation period of spheroid cells.
Characteristic images of invading spheroid cells from those cultured for 4 (A) and 6 (B) days of NB_1 (n = 45 and 43), NB_1(-Mgat2) (n = 49 and 26) and NB_1(-Mgat1) (n = 59 and 48) cell lines and incubated in Matrigel matrix for 16 h duration, and spheroid cells cultured for 6 days (C) and incubated in Matrigel matrix for 24 h duration of NB_1 (n = 21), NB_1(-Mgat2) (n = 23) and NB_1(-Mgat1) (n = 20) cell lines. Scale bar denotes 25 μm. Quantification of cell invasiveness of the various cell lines in which spheroids were cultured for 4 (D) and 6 (E and F) days and incubated in Matrigel matrix for 16 (D and E) and 24 (F) hours. Data are shown as the mean±SEM and were compared by one-way ANOVA using Holm-Bonferroni post-hoc test (*p < 0.05). n denotes number of invading spheroids. Pearson’s correlation coefficient determined from sphere area versus invasion area were the following: NB_1, 0.69; NB_1(-Mgat2), 0.65; NB_1(-Mgat1), 0.75 from 4 day old spheroid allowed to invade for 16 h. Pearson’s correlation coefficients for the following: NB_1, 0.57; NB_1(-Mgat2), 0.62; NB_1(-Mgat1), 0.51, and NB_1, 0.68; NB_1(-Mgat2), 0.51; NB_1(-Mgat1), 0.79 from 6 day old spheroid allowed to invade for 16 h and 24 h, respectively.

