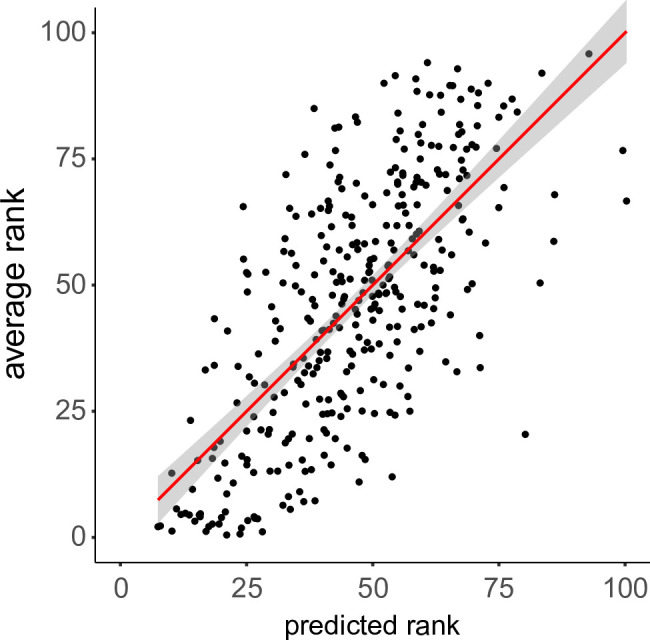
Fig 4. Average rank of drawings versus the ranks predicted by the multiple linear regression model.

The regression line is shown in red with the 95% confidence interval in gray.

The regression line is shown in red with the 95% confidence interval in gray.