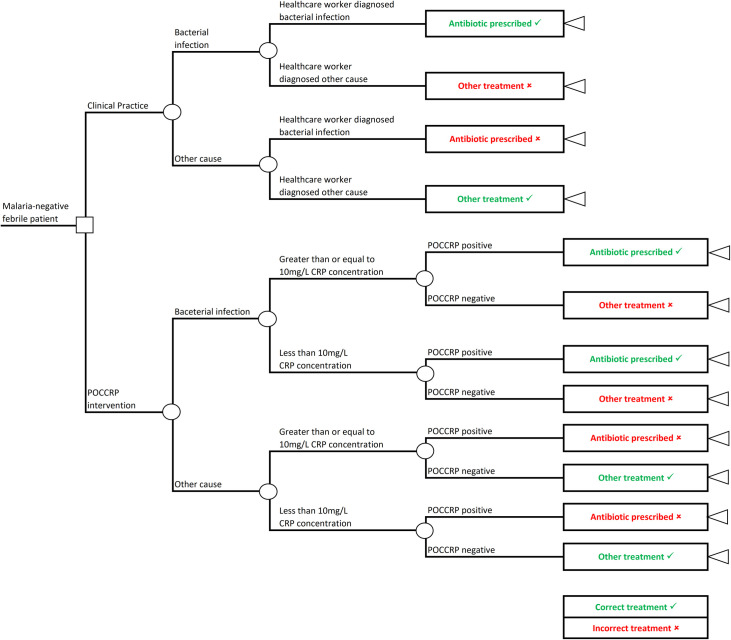
Fig 2. Decision tree.
The square decision node indicates the decision point between the two arms; circular chance nodes show points where two alternative events for a patients are possible [35]. Branches emanating from each chance node indicate possible events and the sum of their probabilities must equal 1; and triangular terminal nodes are at the ends of pathways and represent the outcome of interest [36]. Recommended treatments are green and incorrect treatments are red. Pathways are mutually exclusive sequences of events [35].

