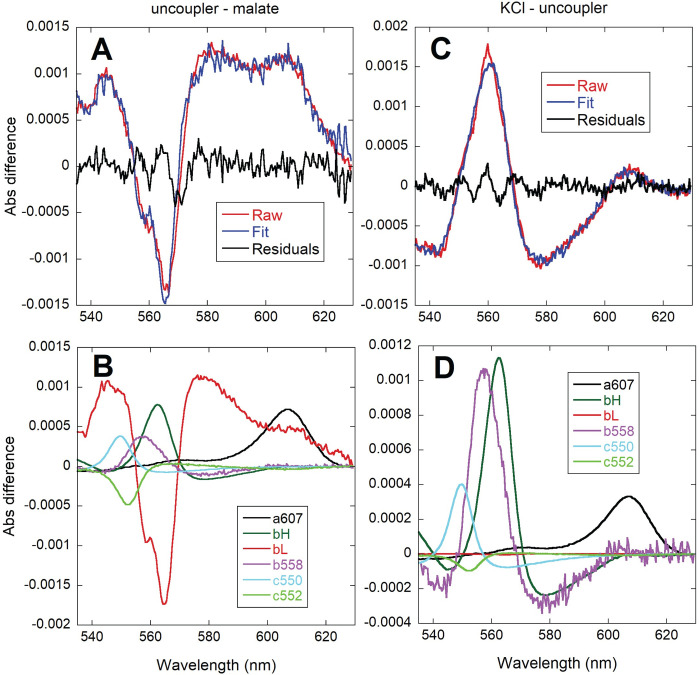
Fig 9.
Comparison of the absorbance changes induced by the addition of 3 μM DBNP after 16.5 mM sodium malate (left, A and B) and 20 mM KCl after DBNP (right, C and D). Difference spectra of 8.4 x 10⁹/ml CyoB-/CcoN- K+ depleted cells were calculated relative to the steady state after sodium malate addition (left) or relative to the steady state after uncoupler addition (right). 200 spectra collected every 0.5 s were averaged for each condition and the resulting averaged spectra were subtracted as indicated (uncoupler-malate or KCl-uncoupler). The top panels (A and C) show the fit (blue) of the raw spectral data (red) and the residuals of the fit (green). The bottom panels (B and D) show the contribution of each cytochrome reference to the fitted spectra.

