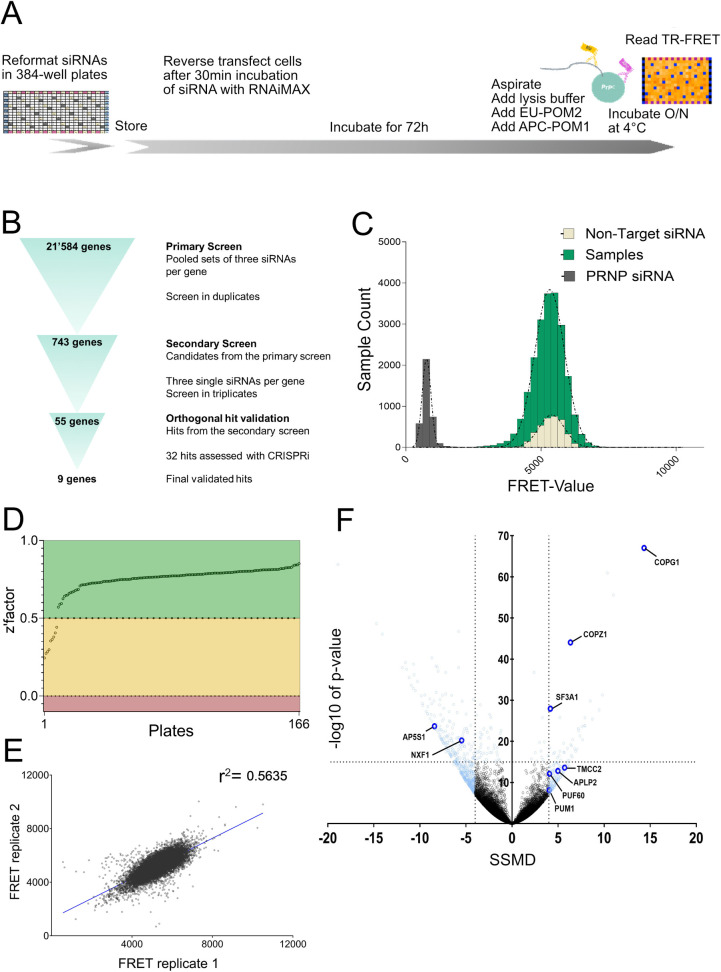
Fig 1. Workflow of the siRNA screen and primary screening round in U251-MG glioblastoma cell line.
(A) Depiction of the screening workflow. (B) Hit selection process. (C) Distribution of populations of positive controls (PRNP targeting siRNAs), negative controls (non-targeting siRNAs) and samples (contents of whole genome siRNA libraries) across FRET values. The x-axis represents PrPC levels measured with TR-FRET; the y-axis represents the number of assays grouped for the given FRET range. Controls showed a strong separation allowing reliable detection of changes in PrPC levels. Most of the sample population did not show a significant regulation when compared to the non-targeting controls. (D) Z’ factor of each plate from the primary screen reporting the separability between the positive and negative controls. (E) Duplicate correlation over all the samples from the primary screen. The Pearson correlation coefficient, r2-value, is depicted in the graph. (F) Volcano plot displaying -log10p-value and SSMD scores across the whole genome dataset. 743 candidates identified in the primary screen are colored in light blue. Final nine hits are colored in dark blue and labelled.

