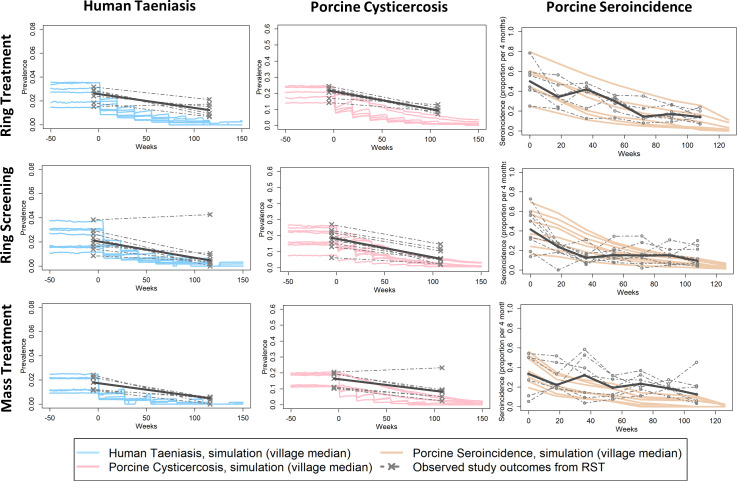
Fig 3. Simulation outcomes versus observed rates of human taeniasis, porcine cysticercosis and porcine seroincidence in the Ring Strategy Trial, by intervention type (n = 21 villages).
Plots display village-specific median simulated outcomes in CystiAgent across 1000 simulations per village, and observed outcomes from RST (median value within intervention type in bold). For ring treatment (n = 6 villages), ring screening (n = 8 villages) and mass treatment (n = 7 villages villages), intervention and without pig treatment are combined. See S1 Fig for sub-arm comparisons of villages with and without the addition of pig treatment.

