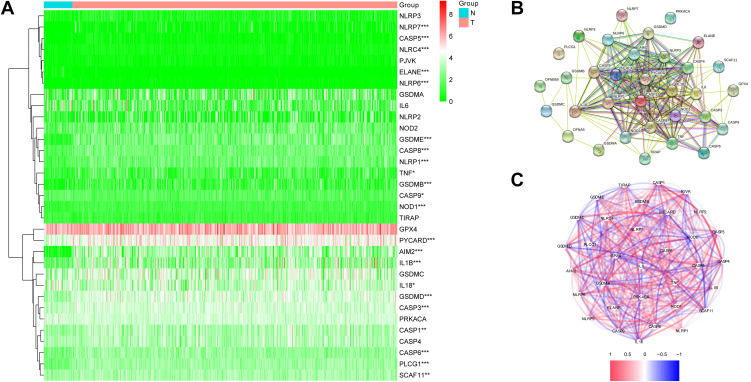
Figure 2.
Expressions of 33 pyroptosis-related genes and interactions between them. (A) Heatmap of pyroptosis-related genes between tumor and normal tissues. P values were showed as: *P < 0.05; **P< 0.01; ***P < 0.001. (B) The PPI network showing the interactions of the pyroptosis-related genes. (C) Correlation network of pyroptosis-related genes.

