Figure 3.
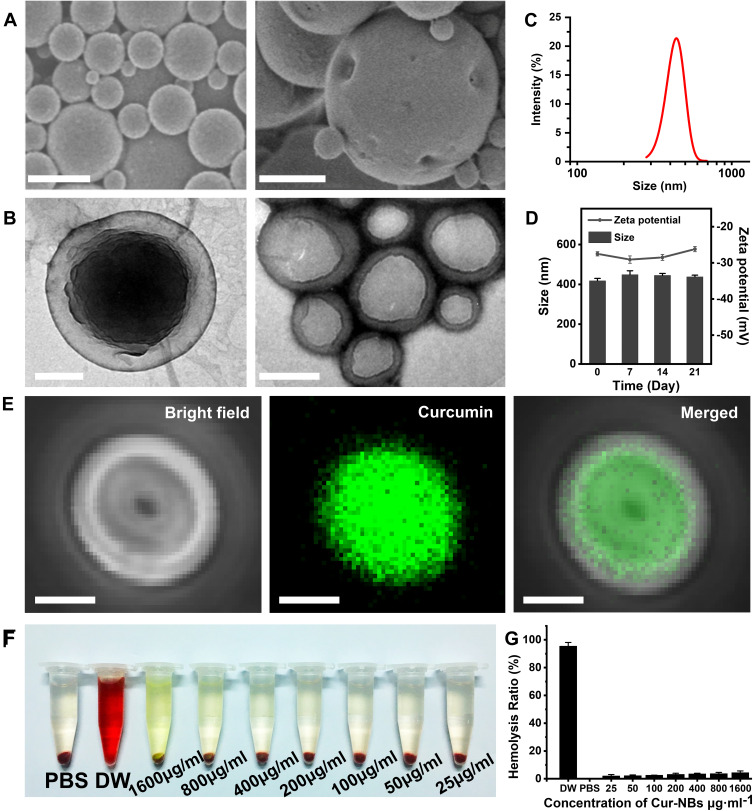
Characterization of Cur-NBs. (A) SEM of Cur-NBs after lyophilization. 500 nm (left scale bar), 250 nm (right scale bar). (B) TEM image of Cur-NBs. 100 nm (left scale bar), 200 nm (right scale bar). (C) DLS particle-size distributions of Cur-NBs. (D) The zeta potential and size changes of Cur-NBs measured within 3 weeks. (E) Observation of Cur-NBs under confocal fluorescence microscope (from left to right: bright field diagram, shell and internal cavity containing curcumin fluorescence, merged). Scale bar is 200 nm. (F and G) Hemolysis rate of Cur-NBs at different concentrations (25, 50, 100, 200, 400, 800, 1600 μg/mL).

