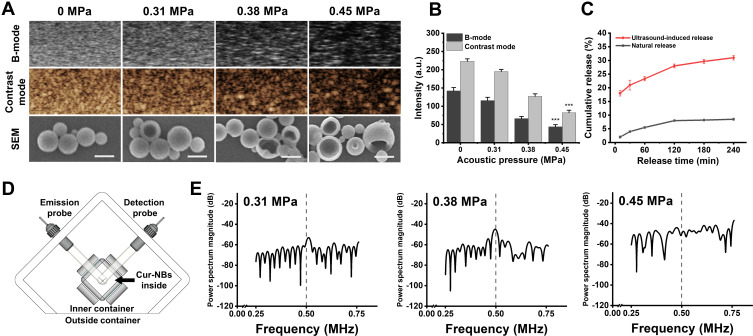
Figure 4.
Ultrasound-mediated destruction of Cur-NBs and drug release. (A) Destruction of Cur-NBs at various acoustic intensities (0, 0.31, 0.38, 0.45 MPa) and their images evaluated in B-mode, contrast mode and SEM. Scale bar is 250 μm. (B) Quantitative analysis of b-mode and contrast mode signal intensities under various acoustic intensities. ***P < 0.001 vs 0 MPa group. (C) The time curve of curcumin release from Cur-NBs in the natural state or ultrasound destruction. Data were represented as mean ± SD. (D) Schematic illustration of sub-harmonic detect setup. (E) The characteristics of sub-harmonic waves were detected at various acoustic intensities (0.31, 0.38, and 0.45 MPa).

