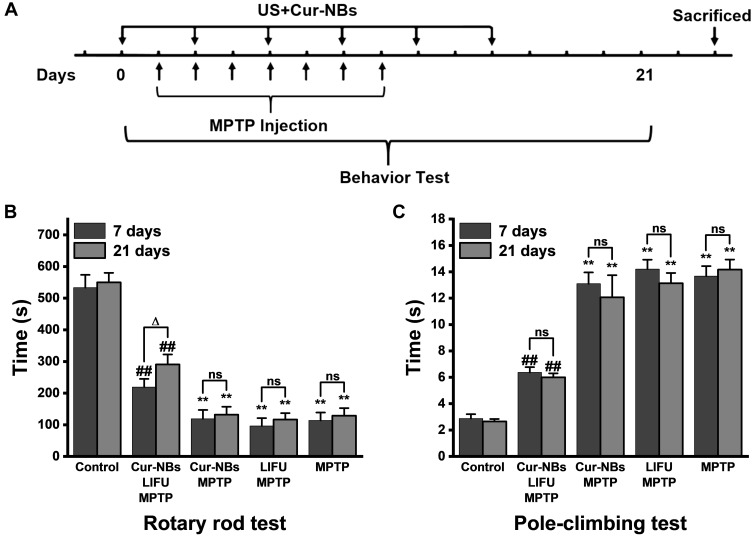
Figure 7.
The behavior analysis. (A) The treatment regimen schematic of MPTP-induced mouse model of Parkinson’s disease (n = 6 per group). (B) Rotatory-rod test of PD and healthy control mice at 7 and 21 days after the first MPTP injection (n = 6 per group). (C) Pole-climbing test of PD and healthy control mice at 7 and 21 days after the first MPTP injection (n=6 per group). **P < 0.01 vs control group, ##P < 0.01 vs MPTP group, ΔP < 0.05 between two groups, ns = not significant (P > 0.05) between two groups.

