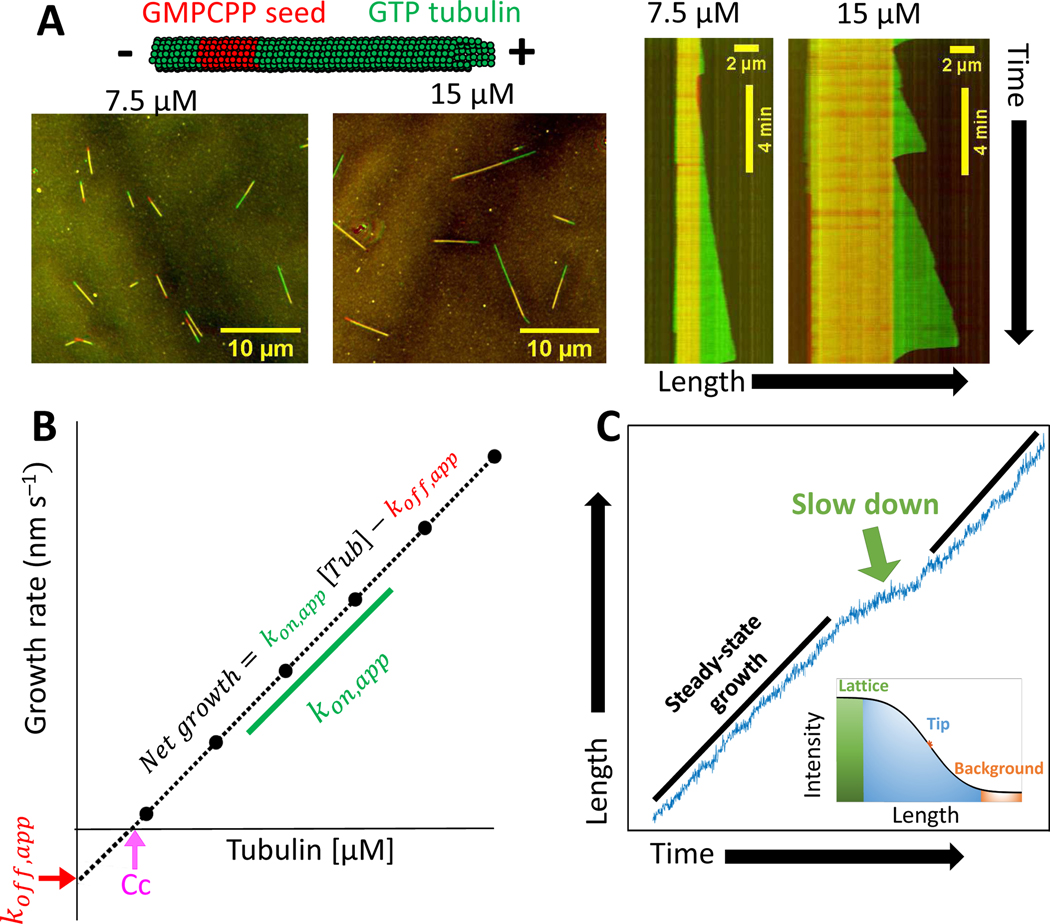
Figure 2. Experimental measurements of tubulin kinetics.
(A) Schematic of microtubule growth in vitro from stabilized GMPCPP seeds. Images show growth from GMPCPP seeds after 10 minute incubation in 7.5 μM and 15 μM free tubulin. Kymographs show the associated growth dynamics, which include periods of steady growth and catastrophes. (Unpublished data.)
(B) Schematic plot of the mean microtubule growth rate as a function of the free tubulin concentration. The critical concentration for growth (Cc) is estimated from the x-intercept, the apparent tubulin on-rate constant (kon,app,) is estimated from the slope, and the apparent tubulin off-rate constant (koff,app,) is estimated from the negative of the y-intercept.
(C) Localization of microtubule end positions at a high spatial resolution is resolved by fitting the spatial decay of intensity using a survival function (inset) reveals fluctuations in growth and slowdown events. (Unpublished data.)

