FIGURE.

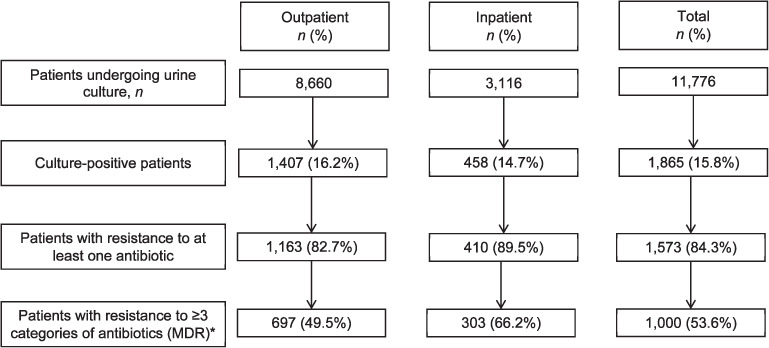
Flow chart of urine culture results and antibiotic resistance among adult samples undergoing urine culture and drug susceptibility testing in Kathmandu, Nepal, May–October 2019. *The percentage was calculated based on the number of culture-positive individuals as denominator.
