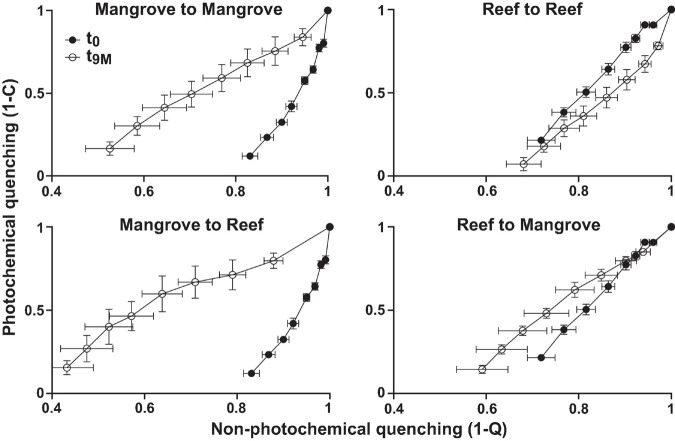
FIGURE 3.
Photophysiology of Pocillopora acuta (mean, n = 3–5) showing photochemical quenching (1-C) versus non-photochemical quenching (1-Q) from Rapid Light Curves for each transplantation treatment; mangrove-mangrove, mangrove-reef, reef-reef, and reef to mangrove at each sampling timepoint; t0 (prior to transplantation) and t9M (after 9 months of transplantation).

