
Figure 1: ADAR1 was induced in both mouse and human AAA lesions.
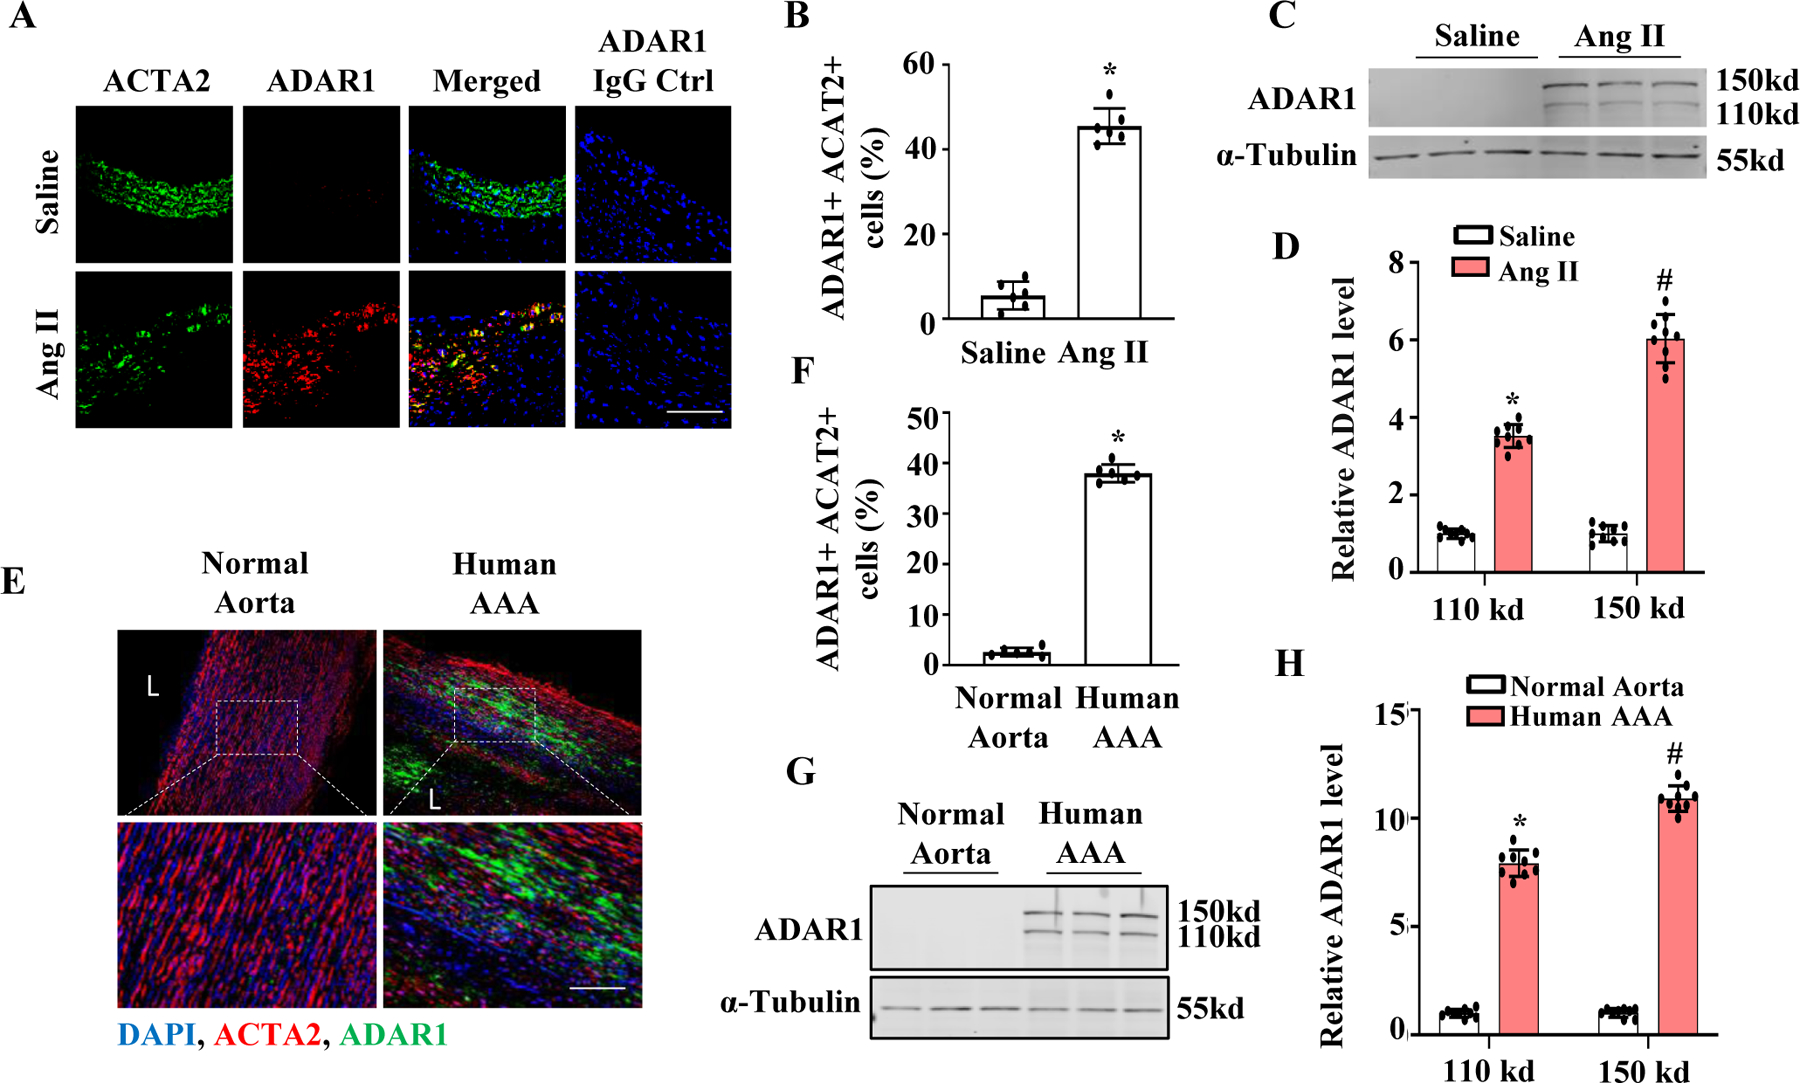
A-D, ApoE−/− Mice were infused with saline or angiotensin II (Ang II, 1000 ng/kg/min) for 28 days. Abdominal aorta sections were co-immunostained with ACTA2 and ADAR1 antibodies (A). The percentage of ADAR1+ACTA2+ cells relative to the total ACTA2+ cells were quantified from 10 sections each animal (B). ADAR1 was expressed predominantly in SMCs in mouse AAA lesions. *P = 4.4e-5 vs. saline-infused mouse aorta, n=6, Fisher’s exact test (two-tailed). (C-D) ADAR1 protein expression in abdominal aorta were examined by Western blotting (C) and quantified by normalizing to α-Tubulin for each ADAR1 isoform, respectively (D). *P = 1.9423e-2, #P = 1.7e-5 vs. saline-treated group for the corresponding isoform. Unpaired t test (two-tailed), n=9. E, Normal healthy human abdominal aorta or AAA sections were co-immunostained with ACTA2 and ADAR1 antibodies. Blue: DAPI, Red: ACTA2, Green: ADAR1. F, Quantitative analyses of the percentage of ADAR1+ ACTA2+ cells relative to the total ACTA2+ cells in each section. *P = 3e-6 vs. normal aorta, n=9, Fisher’s exact test (two-tailed). G-H, ADAR1 protein expression in human abdominal aorta or AAA lesions were detected by Western blotting (G) and quantified by normalizing to α-Tubulin for each ADAR1 isoform, respectively (H). *P = 1.9423e-2 and #P = 1.7e-5 vs. the normal aortas for each isoform, respectively, n=9, Unpaired t test (two-tailed). Shown are fold inductions relative to the mean value of saline-infused (B & D) or human normal aortas (F & H), which was set as 1.