
Figure 3: ADAR1 promoted MMP2 and MMP9 production and their activity in AAA lesions.
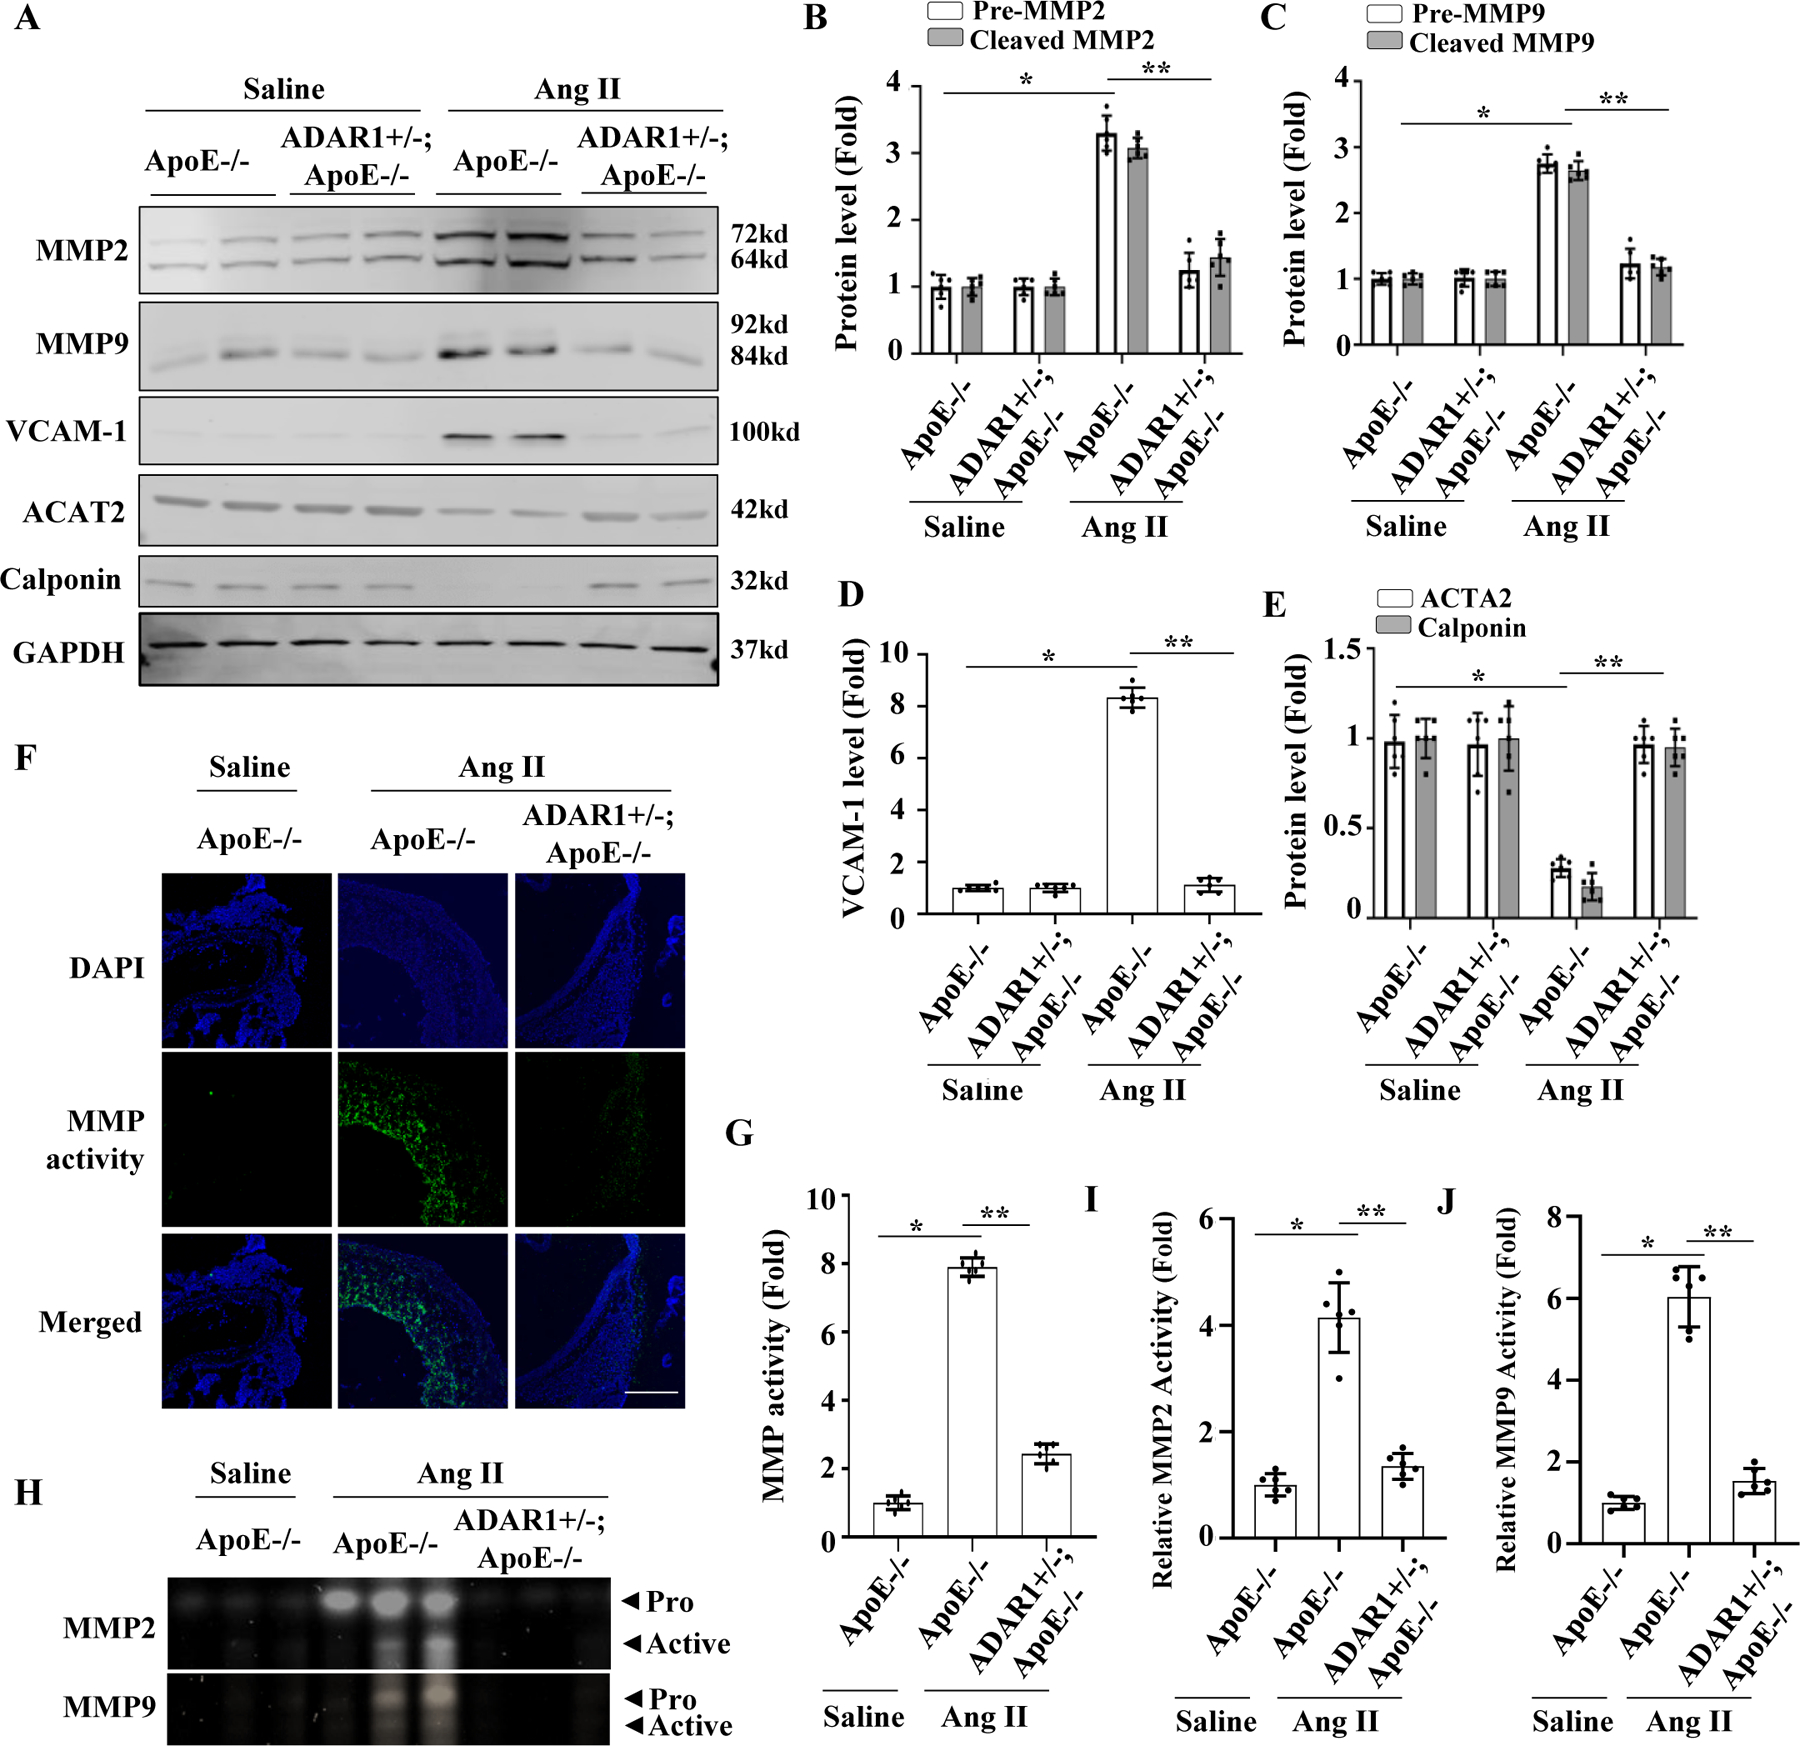
A-E, ApoE−/− and ADAR1+/− mice in ApoE−/− background were infused with saline or Ang II (1000ng/kg/min) for 14 days. The protein levels of pre- and active MMP2 (B), MMP9 (C), VCAM-1 (D), ACTA2 & Calponin (E) were detected by Western blot and quantified by normalizing to GAPDH. *P =2.34E-02 for pre-MMP2, 2.70E-02 for cleaved-MMP2 (B), 1.87E-02 for pre-MMP9, 2.87E-02 for cleaved-MMP9 (C), 1.80E-02 (D), 2.40E-05 for ACTA2, 4.40E-05 for Calponin (E) vs. WT with saline infusion, respectively (n=6); **P = 3.31E-02 for pre-MMP2, 2.40E-02 for cleaved-MMP2 (B), 8.70E-02 for pre-MMP9, 7.60E-02 for cleaved-MMP9 (C), 2.10E-02 (D), 3.20E-05 for ACTA2, 4.20E-05 for Calponin (E) vs. ApoE−/− mice with Ang II infusion, respectively (n=6). F-G, In situ zymography of aorta showing increased MMP activity in Ang II-infused ApoE−/− mouse aorta, which was mitigated in ADAR1+/− aorta. Green fluorescence indicates MMP activities, which were quantified by normalizing to the fluorescent signal intensity in saline-treated mice, Scale bar = 30 um. *P = 2.80E-04 vs. WT with saline infusion; **P = 2.40E-02 vs. ApoE−/− mice with Ang II infusion, n=6. H-J, Aorta homogenates of ApoE−/− and ADAR1+/−; ApoE−/− mice infused with saline or Ang II for 14 days were prepared, and MMP2 and MMP9 activities were examined by gelatin zymography (H), measured by densitometry, and quantified by normalizing to the saline-infused group (I-J). *P = 3.60E-03 (I) and 2.90E-03 (J) vs. ApoE−/− mice with saline infusion, respectively (n=6); **P = 3.30E-02 (I) and 1.30E-02 (J) vs. ApoE−/− mice with Ang II infusion, respectively (n=6). All protein levels or activities were shown as fold inductions relative to the mean value of saline-infused ApoE−/− mouse group, which was set as 1 in each comparison. Kruskal-Wallis test with Dunn’s multiple comparisons tests were performed to determine statistical difference for all panels.