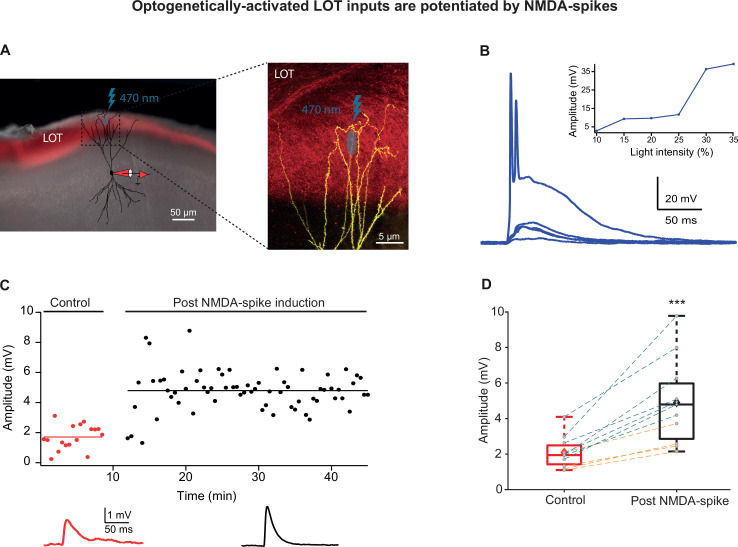
Figure 5. Optogenetically activated lateral olfactory tract (LOT) inputs were potentiated by NMDA-spikes.
(A) Experimental setup. Left panel: coronal slice of piriform cortex (PCx) from a mouse previously injected in olfactory bulb (OB), with a virus expressing ChR2 (pAAV.CAG.hChR2(H134R)-mCherry.WPRE.SV40) in LOT fibers (red fluorescence). A pyramidal neuron from layer IIb was loaded with CF633 (200 µM) and OGB-1 (200 µM) via a somatic patch electrode (red electrode) and was reconstructed after the recording session. Right panel: opto-EPSPs and NMDA-spikes were evoked by light stimulation (LED 470 nm) directed to a small portion of the distal apical dendrite (~5 µm2). (B) Voltage responses evoked by gradually increasing ontogenetic light intensity (three pulses of 5 ms at 50 Hz). Peak voltage responses as a function of % light intensity showing an all-or-none spike response (inset). (C) Amplitude of single opto-EPSPs is represented over time for control stimulation and after NMDA-spike induction protocol at distal apical dendrite. Bottom panel: average opto-EPSP in control (red), post-NMDA-spike induction (black). (D) Box plot showing opto-EPSP amplitudes pre- and post-NMDA-spike induction for LOT inputs. Opto-EPSPs were significantly enhanced post-NMDA-spike optogenetic induction protocol, 232.45% ± 16.55% of control (p=0.000286; n = 11). The gray dots represent the average EPSP of each experiment, and the diamond represents the mean of the entire set. Experiments with optogenetic activation of LOT inputs (blue lines) and experiments with glutamate uncaging (orange lines) were pooled together. There was no significant difference in the level of potentiation between these two activation methods (194.2% ± 9.2%, n = 4, and 254.3% ± 23.6%, n = 7, for glutamate uncaging and opto-EPSPs, respectively, p=0.08). Dotted gray lines connect between pairs of control and post-induction values.

