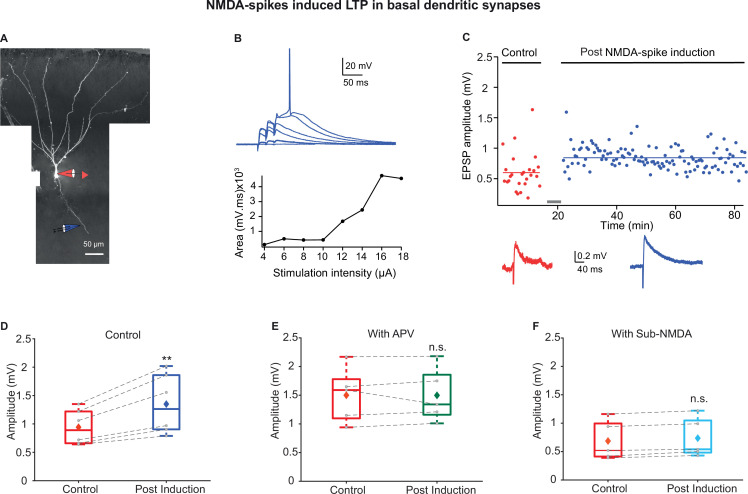
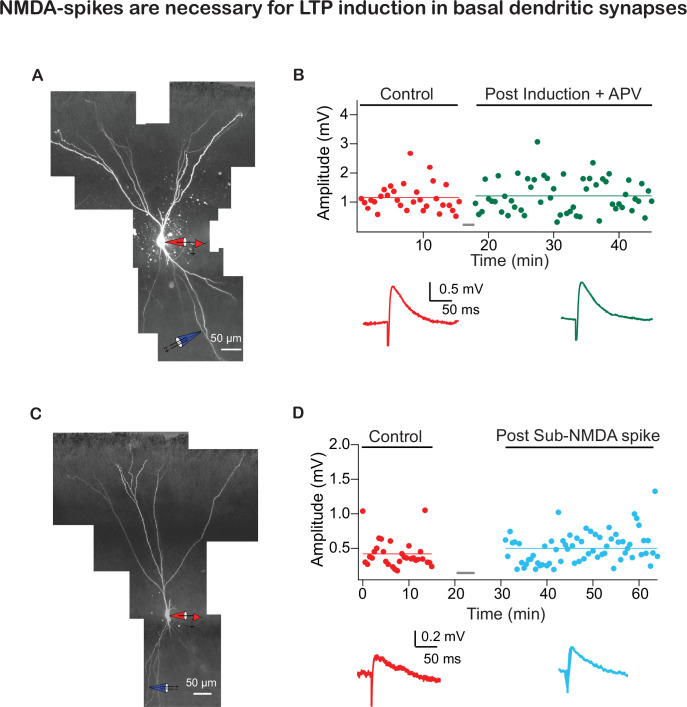
Figure 7. Long-term potentiation (LTP) of basal inputs induced by local NMDA-spikes in piriform cortex (PCx) pyramidal neurons.
(A) Fluorescence image reconstruction of a layer IIa pyramidal neuron filled with CF633 (200 µM) and OGB-1 (200 µM) via a somatic patch electrode (red electrode). Focal stimulation was performed using a theta electrode placed nearby a distal basal dendrite (blue electrode; 144.83 ± 9.21 µm from soma), while recording at soma. (B) Voltage responses evoked by gradually increasing synaptic stimulation consisting of a burst of three pulses at 50 Hz. With gradually increasing stimulus intensity, an NMDA-spike was evoked (top). The peak voltage response is presented as a function of stimulation intensity for the voltage responses shown above (bottom). (C) Amplitude of single EPSPs is represented over time for control stimulation and NMDA-spike induction protocol at a basal dendrite. EPSPs were recorded at 0.033 Hz before and after the induction. Down: average EPSPs during control (red) and post-NMDA-spike induction paradigm (blue). (D) Box plot depicting EPSP amplitudes pre- and post-NMDA-spike induction protocol. NMDA-spike induction protocol induced potentiation of the control EPSP, 140.64% ± 4.5% of control (p=0.006526, n = 6). The gray dots represent the average EPSPs for each cell, and the diamond represents the mean EPSPs of the entire set. (E) Box plot showing EPSP amplitudes pre- and post-LTP induction protocol in the presence of APV. No significant change in EPSP amplitudes was observed, 100.69% ± 4.27% of control (p=0.9948, n = 5). (F) Box plot showing EPSP amplitudes pre- and post-LTP induction with sub-NMDA EPSPs at 4 Hz. No significant change in EPSP amplitudes was observed, 108.73% ± 3.13% of control (p=0.825, n = 5). In the box plots, the gray dots represent the average EPSPs of each experiment, and the diamond represents the mean of the entire set. Dotted gray lines connect between pairs of control and post-induction values. Data for (B–F) can be found in Figure 7—source data 1. See also Figure 7—figure supplement 1.


