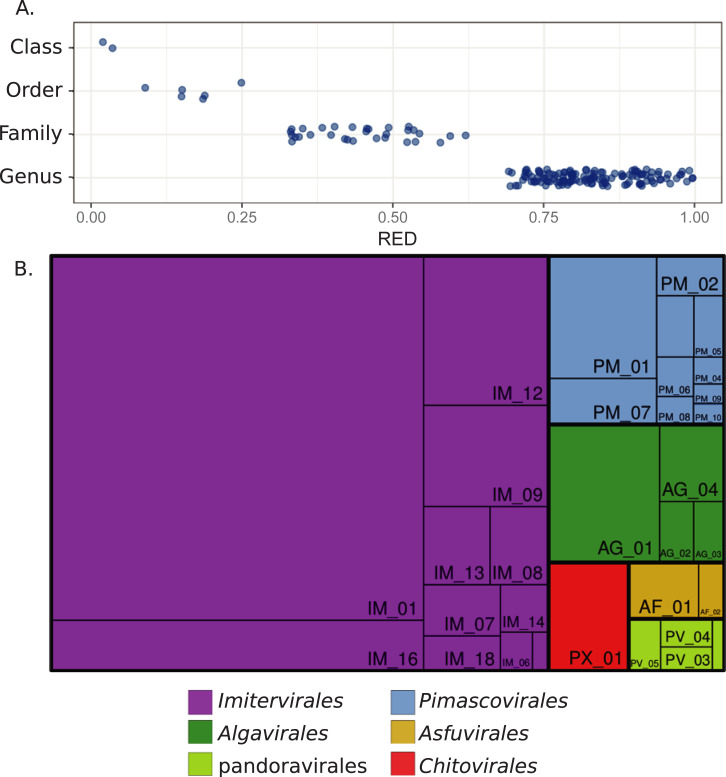
Fig 3. Summary of the Nucleocytoviricota taxonomy.
(A) RED values for Nucleocytoviricota classes, orders, and families, and genera. (B) Treemap diagram of the Nucleocytoviricota in which orders and families are shown. The area of each rectangle is proportional to the number of genomes in the respective taxon. RED values can be found in S3 Data. RED, relative evolutionary divergence.

