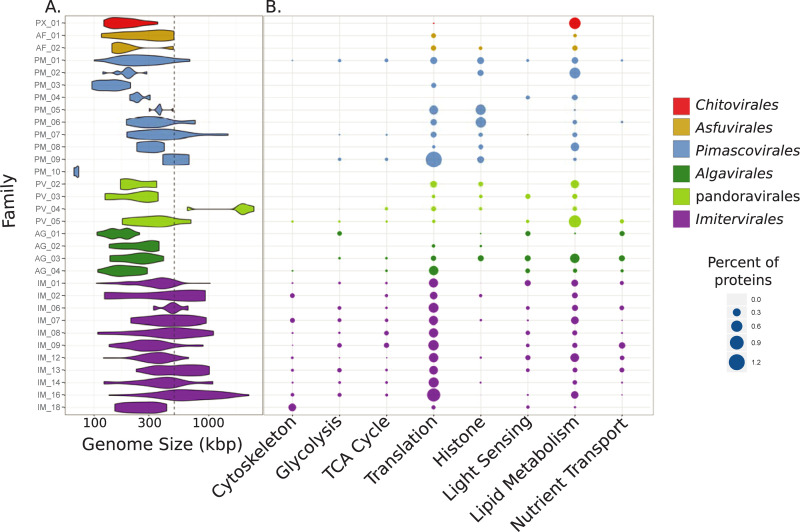
Fig 4. Genomic characteristics of the Nucleocytoviricota.
(A) Violin plot showing the genome size distribution across the Nucleocytoviricota families. The dashed gray line denotes 500 kbp. (B) Bubble plot showing the percent of total proteins in each family that could be assigned to GVOGs that belonged to particular functional categories (details in S2 Data). GVOG, giant virus orthologous group.

