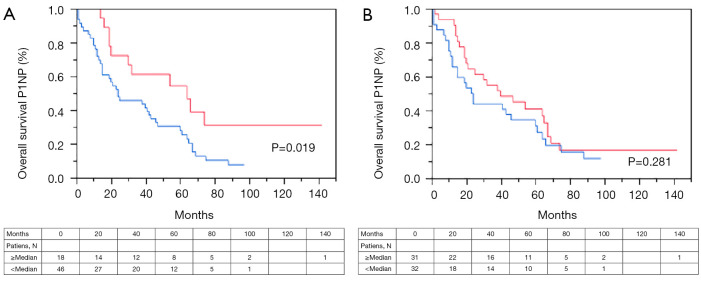
Figure 4.
Kaplan-Meier curve for OS in patients with bone metastases and 1CTP (A) and P1NP (B) measurement. Blue curves: marker concentration ≥ median, red curves: marker concentration < median value. OS, overall survival; 1CTP, c-terminal telopeptide of type I collagen; P1NP, peptides n-terminal propeptide of type I procollagen.

