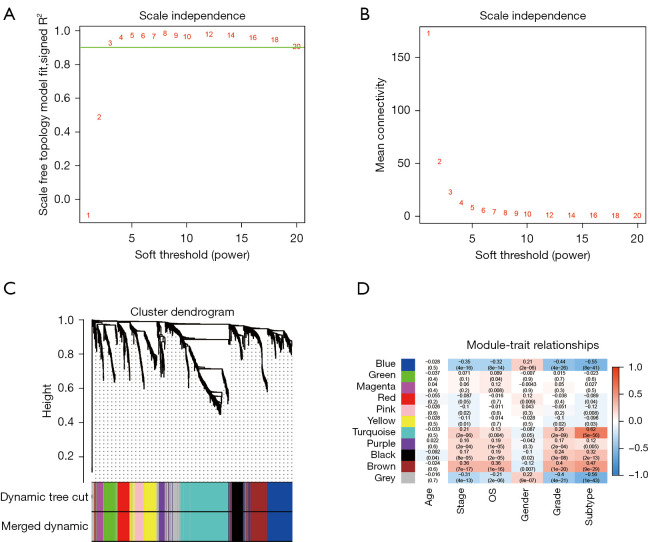
Figure 3.
Identification of key modules connected with clinical features and immune subtypes through WGCNA. (A,B) The scale-free fit index and the mean connectivity for various soft-thresholding powers, respectively. When the soft-thresholding powers (β) equaled three, the average degree of connectivity was close to zero. (C) The cluster dendrogram of 5,000 module eigengenes from the TCGA dataset. Each branch in the figure represented one gene, and every color below represented one co-expression module. (D) Heatmap of the correlation between module eigengenes and clinical traits, including molecular subtypes. The color of cells in the heatmap represented the correlation coefficients of different sizes. Specifically, red colors represented the positive correlations, and green colors stood for the negative correlations. The figure without brackets in each cell indicated the clinical feature correlation coefficients. The corresponding P value was shown below in parentheses. WGCNA, weighted correlation network analysis; TCGA, The Cancer Genome Atlas.

