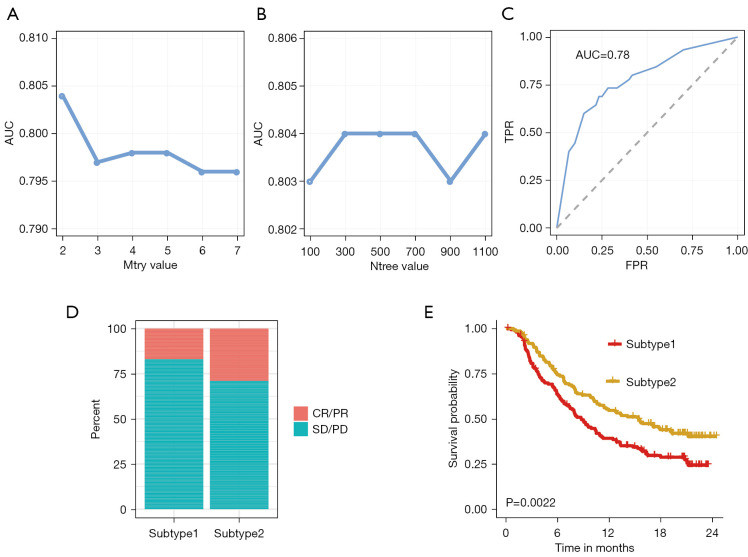
Figure 6.
Parameter tuning and model validation. (A) The ‘mtry’ with the highest AUC was selected as the optimal value of the RF algorithm. (B) The ‘ntree’ with the highest AUC was selected as the optimal value of the RF algorithm. (C) Validation of model in the testing dataset. (D) The correlation of predicted immune subtype with the response rate to immunotherapy in the IMvigor210 dataset. (E) The correlation of predicted immune subtype with the survival analysis in the IMvigor210 dataset. AUC, area under the receiver operating characteristic curve; RF, random forest; CR, complete response; PR, partial response; SD, stable disease; PD, progressive disease.

