Figure 12.

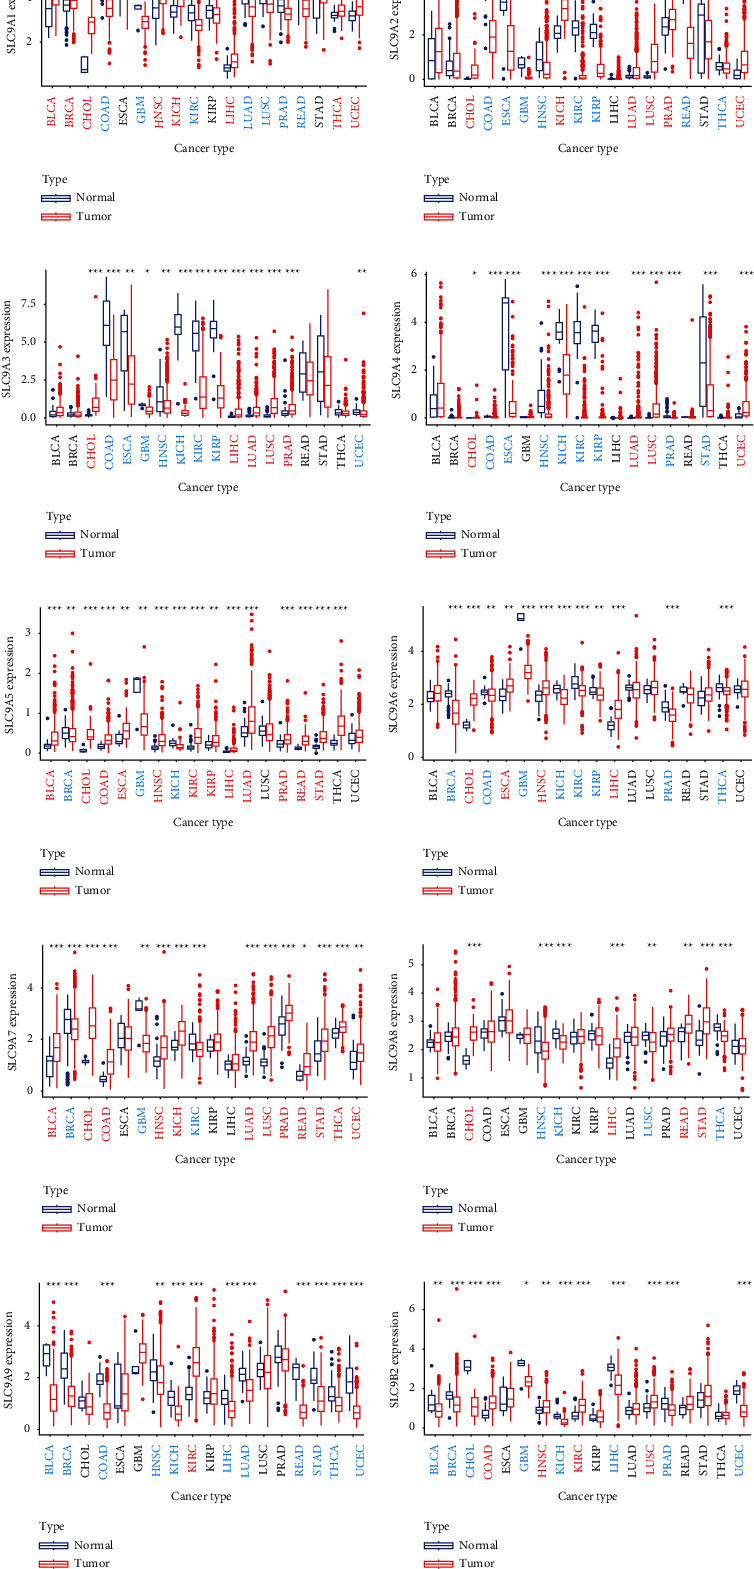
Pan-cancer analysis of NHE family from TCGA data. Red cancer names mean high expression, and blue cancer names mean low expression. The symbols “∗,” “∗∗,” and “∗∗∗” indicate p values of <0.05, <0.01, and <0.001, respectively.

Pan-cancer analysis of NHE family from TCGA data. Red cancer names mean high expression, and blue cancer names mean low expression. The symbols “∗,” “∗∗,” and “∗∗∗” indicate p values of <0.05, <0.01, and <0.001, respectively.