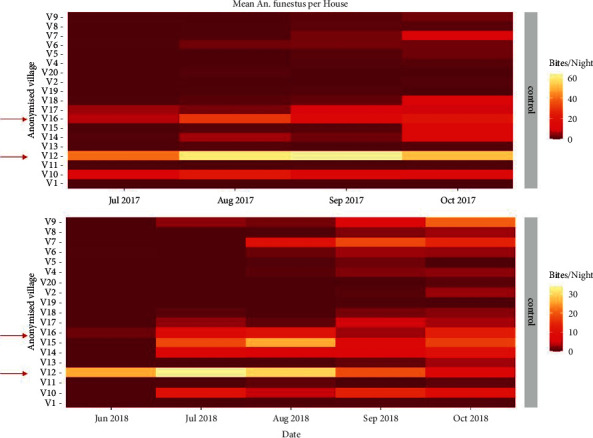
Figure 1.

The mean An. funestus count per house in control villages from the study [35] from June to September 2017 and 2018. Our study villages, chosen for the highest An. funestus count during the season of interest, are highlighted with red arrows.
