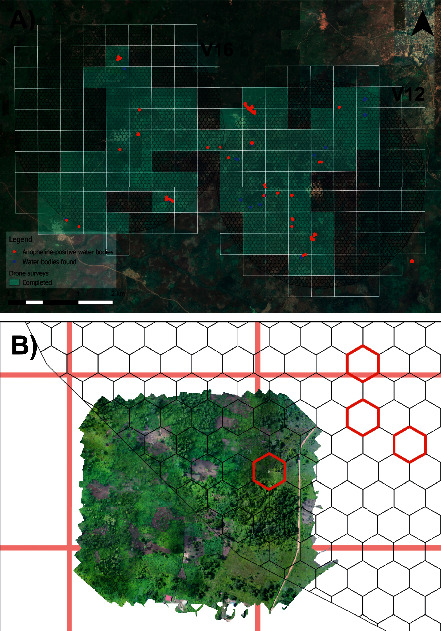
Figure 7.

(a) A rectangular grid used to plan drone flights, with the grey coloured rectangles highlighting drone flights. (b) Example of a 600 × 650 m orthomosaic generated from a single flight. The red rectangular grid indicates the guidelines used in the field to plan the drone flights, and the red hexagons are random sampling locations.
