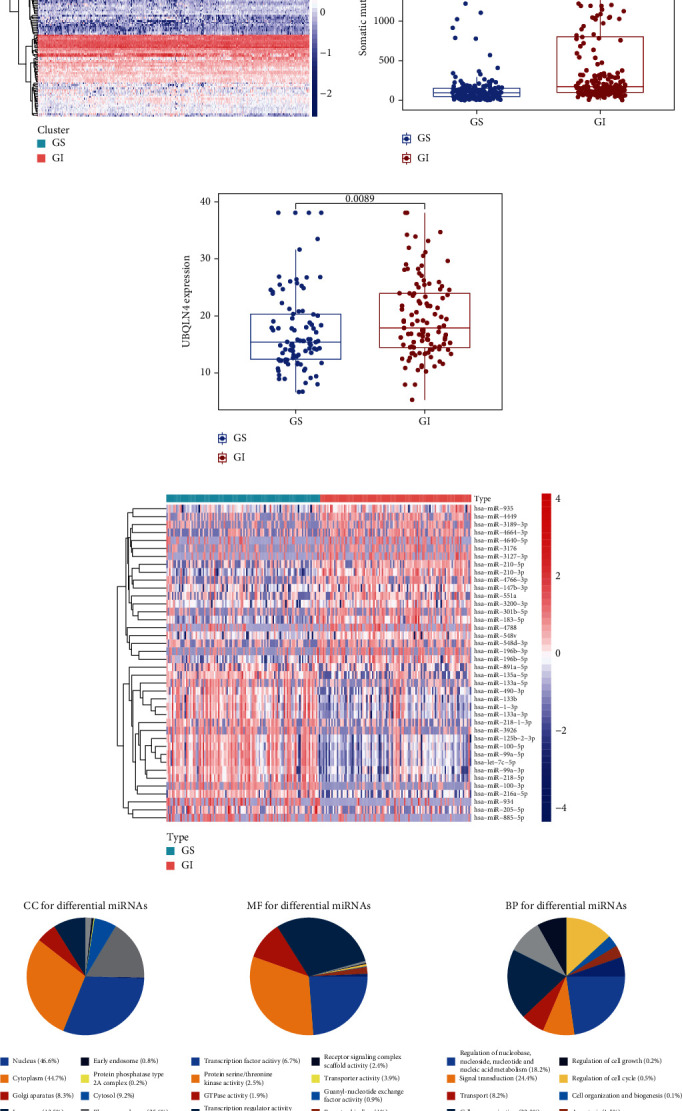
Figure 1.

Identification of genomic features in the GS and GI groups. (a) Clustering heatmap of GS and GI patients based on differentially expressed miRNAs. The left part (red) represents the GI patients and the right part (green) represents the GS patients. (b) Somatic mutation count and (c) UBQLN4 expression were significantly elevated in the GI patients compared to the GS patients. The blue dots indicate GS patients, and the red dots indicate GI patients. (d) Heatmap of the top 40 differential miRNAs between GS and GI groups. The red represents the GI patients, and the green represents the GS patients. (e) GO analysis of differential miRNAs.
