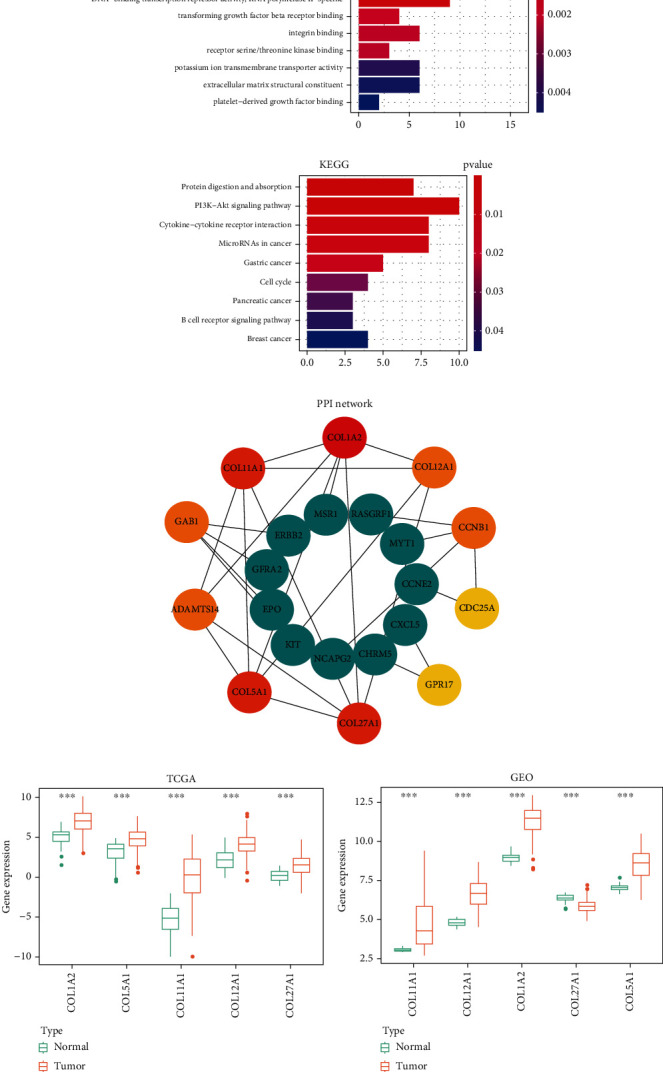
Figure 11.

Target genes of the GIMiSig. (a) GO and (b) KEGG analyses of target genes. (c) PPI network of hub genes. The top 10 hub genes are indicated in red, orange, and yellow. (d) Expression of the 5 genes was compared between normal and tumor groups from TCGA and (e) GSE54129. Orange indicates the tumor group, and green indicates the normal group. ∗p < 0.05, ∗∗p < 0.01, and ∗∗∗p < 0.001.
