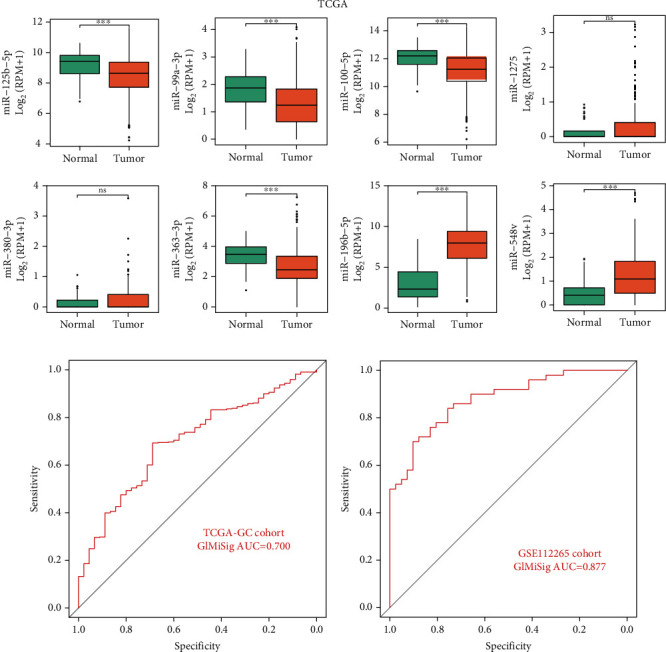
Figure 6.

Diagnostic value of the GIMiSig. (a) Expression levels of the 8 miRNAs between the normal and tumor groups in TCGA. AUC values of the GIMiSig to diagnose GC patients in TCGA cohort (b) and GSE112264 cohort (c). Orange indicates the tumor group, and green indicates the normal group. ∗p < 0.05, ∗∗p < 0.01, and ∗∗∗p < 0.001.
