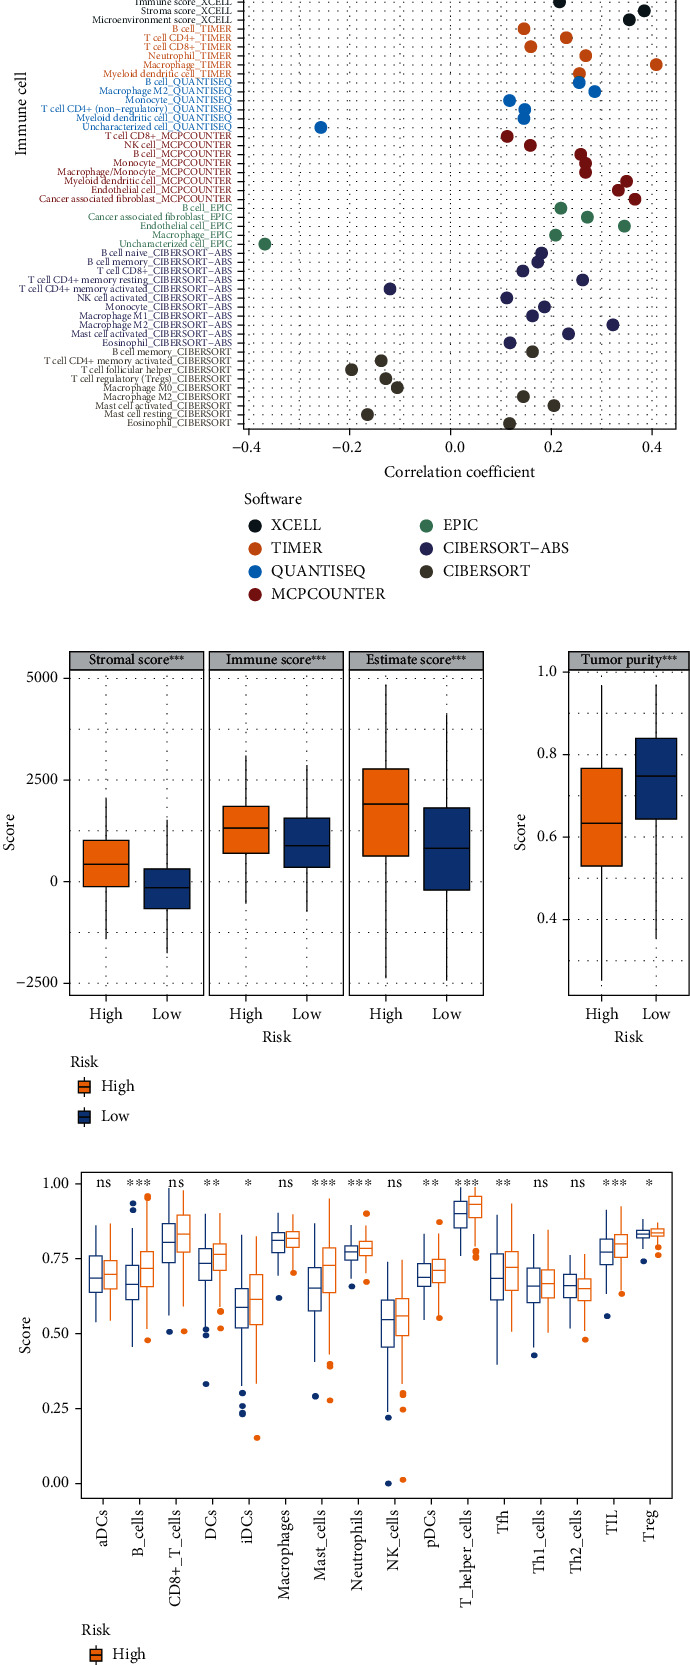
Figure 8.

Immune landscape in the high- and low-risk groups. (a) Correlation analysis between the GIMiSig and various intratumor cell subpopulations. (b) Evaluation of immune landscape in the high- and low-risk groups based on ESTIMATE. (c) Boxplots showing distribution of immune cells in the high- and low-risk groups using the ssGSEA algorithm. Yellow indicates the high-risk group, and blue indicates the low-risk group. ∗p < 0.05, ∗∗p < 0.01, and ∗∗∗p < 0.001.
