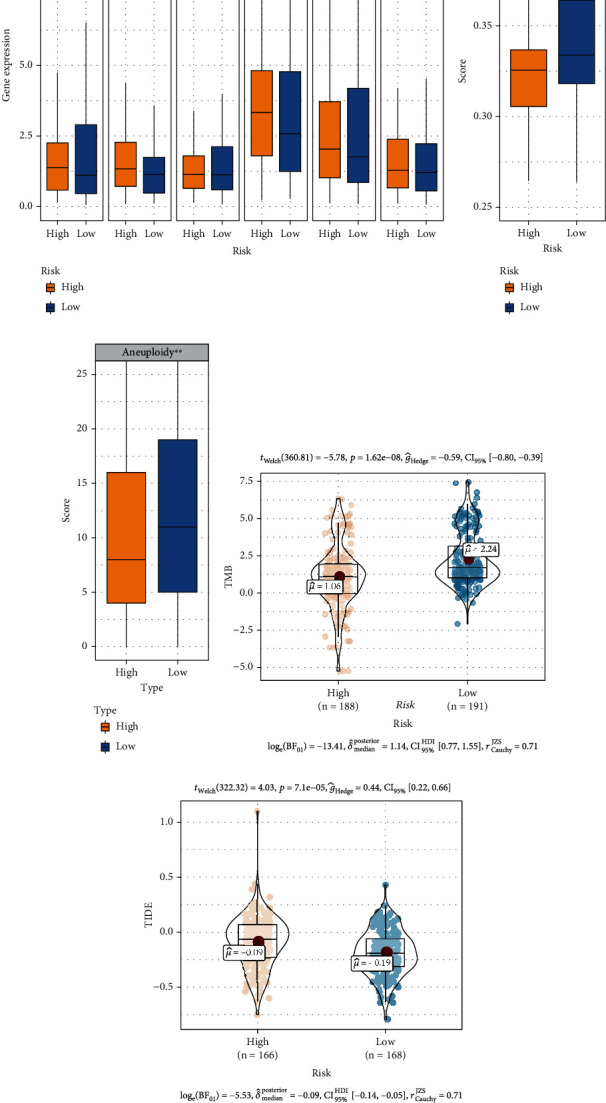
Figure 9.

Prediction of immunotherapy responsiveness. (a) Relationships between the GIMiSig and immune checkpoint-related gene expression levels. Comparison of (b) microsatellite instability (MSI) score, (c) aneuploidy score, (d) tumor mutation burden (TMB), and (e) Tumor Immune Dysfunction and Exclusion (TIDE) score in the high- and low-risk groups. ∗p < 0.05, ∗∗p < 0.01, and ∗∗∗p < 0.001.
